
If you want to have a deep understanding of your site’s performance, you need user journey analytics.
Table of Contents
A user journey is the steps a typical customer takes from finding your site to completing your goal, like purchasing a product/service.
User journey analytics means tracking the behavior of your visitors in each step of the user journey. In fact, you’ll obtain a detailed picture of what is happening throughout the user path, especially where they leave your site.
This helps you find strengths and weaknesses of your site in more detail compared to traditional analytics.
This blog explains the benefits of user journey analytics for your site and the best tools you can use for customer journey tracking.
Why You Need User Journey Analytics
First, let’s look at why you need to track the customer journey on your site, beyond monitoring traditional metrics like traffic.
Benefits of User Journey Analytics
- Understand the complete visitor journey: It shows you how visitors find your site and move from their first interaction to conversion, exit, or return visit.
- Identify best user paths: You can find which sequences of pages and interactions are most useful. In other words, you’ll learn which path leads to more purchases, signups, leads, or other important goals.
- Spot friction and drop-off points: User journey analytics helps you identify where visitors abandon forms, funnels, checkout processes, or other important journeys.
- Understand visitor intent: It shows you what visitors search for, read, click, and interact with. So, you can learn what you have to focus on more.
- Discover unexpected patterns: It helps you find journeys that differ from common paths. So, you can use them as new opportunities to improve navigation and internal linking.
- Improve user experience (UX): User journey shows behavioral patterns that are useful for identifying confusing pages, unnecessary steps, or interactions that make visitors leave your site.
- Optimize sales funnels: You can track what people did on your pages before they leave your site. This helps you optimize CTAs, events, navigation, offers, and other important items in your conversion funnels.
Overall, user journey analytics gives you a deep insight into what happened on your site and why users did it.
Traditional Website Analytics vs. User Journey Analytics
To understand the benefits of user journey analytics, it would be useful to compare it with traditional analytics:
| Traditional Website Analytics | User Journey Analytics |
| Measures individual metrics | Connects interactions during the journey |
| Shows the traffic of a page | Shows where the page is in the journey |
| Focuses on pageviews and sessions | Focuses on behavioral patterns |
| Reports total conversions | Shows the paths and events before conversions |
| Identifies bounce and exit rates | Helps you find why users drop off |
| Shows entry and exit pages | Shows what users did on these pages |
| Measures aggregate performance | Enables behavioral segmentation and comparison |
In sum, traditional analytics shows what happened on your site, but user journey analytics lets you know why and how it happened.
Key Steps in the User Journey on Your Website
The user journey might be different for websites and industries, but we can divide it into 5 main stages:
- Awareness
- Consideration
- Purchase
- Retention
- Advocacy
These stages are a bit general. When you want to analyze the user journey on your website, you can break it into more specific steps, like:
| Stage | Visitor Goal | Useful Data |
| Discovery | Find a solution or answer | Source, campaign, search query |
| Landing | Decide whether the page is useful | Landing page, engagement, scroll |
| Exploration | Learn more | Pageviews, navigation, internal search |
| Engagement | Interact with content | Clicks, video plays, downloads, scrolls |
| Consideration | Compare options | Product views, pricing views, FAQs |
| Conversion | Complete a goal | Form submission, purchase, signup |
| Post-conversion | Get value or continue | Logins, downloads, return visits |
Let’s review these steps in more detail:
1. Discovery
First, people should find your website using different channels, including:
- Organic search
- Paid advertising
- Social media
- Referral websites
- Direct traffic
- Online communities
- Another page on your website
This is the step where you find out where your customers come from. Accurate traffic source segmentation at this stage can help you recognize your audiences and understand their behavior. Sometimes you have to use UTM links to analyze the source of your traffic.
2. Landing
The landing page is the first page visitors start interacting with your website. The entry page might be one of your articles or your homepage.
It’s important to list the best-performing entry pages in terms of traffic and conversion. This means you should not only consider the number of visitors who start their journey using the page, but also the percentage of them who convert.
Analyzing the behavior of users after arriving at the landing page is really useful. It shows what pages and content users like or dislike.
Here are key metrics to track at this stage of the user journey:
- Scroll depth
- Average time on page
- Bounce rate
- Engagement rate
- Sequencing page views
- CTA clicks
- Conversion rate
Moreover, it’s good to use more advanced monitoring features like heatmaps and session recording at this stage. This way, you can understand what users are doing on the entry page and detect friction, rage clicks, and user UI issues.
3. Exploration
If visitors find the initial page useful, they’d often begin exploring on your site. For example, they might open related articles, visit category pages, browse products, use internal search, compare services, etc.
Analyzing this stage helps you find unexpected navigation patterns to compare them with the initial path you’ve considered in your site design.
For example, you might design: Homepage → Services → Contact.
But when you analyze the real user journey, you see the high-performing path is:
Google → Blog Article → Case Study → Pricing → Contact
This gives you useful insights to optimize internal linking, CTA placement, content strategy, and navigation design.
Here are the metrics you have to track for analyzing exploration:
- Pages per session
- Next-page path
- Navigation path
- Internal search usage
- Exit rate
4. Engagement
The definition of engagement might be different in various web analytics tools. It’s usually any interaction or at least spending a minimum amount of time on a page.
Measuring engagement is one of the most important purposes of user journey analysis. You need to go deeper to see what encourages users to engage and what makes them leave your site.
Here are some metrics that measure different aspects of engagement:
- CTA clicks
- Video engagement
- Downloads
- Internal searches
- Form interactions
- Product comparisons
- Accordion or FAQ interactions
- Scroll depth
- Outbound clicks
- Add-to-cart actions
The goal is to identify behaviors that indicate that a visitor is moving closer to an important outcome.
5. Consideration
At this stage, visitors usually reach a clearer idea of whether they need your services/products. However, they might not be ready to act yet.
For example, if you have an e-commerce site, visitors might compare your products and shipping information to see whether it’s worth buying.
On SaaS websites, users might visit:
- Pricing
- Documentation
- Integrations
- Case studies
This step is important because you can understand what leads them into conversion and what makes them leave your site.
6. Conversion
Conversion is actually your business goal and includes a wide range of actions, like:
- Purchasing a product
- Submitting a lead form
- Starting a free trial
- Booking a consultation
- Creating an account
- Subscribing to a newsletter
- Downloading a resource
- Requesting a quote
Conversion analytics is the most important step in user journey analytics. It helps you understand the path of users from the first step to the final goal. List the paths with the highest conversion rate and invest more in them. Also, try to find paths with issues and remove the problems.
7. Post-Conversion & Return Visit
Many website owners think that the user journey ends after conversion. However, your relationship with customers has just begun.
You have to build a strong strategy for post-conversion tracking and the way you can make customers loyal to your brand.
Post-conversion activity can really vary by industry, and you have to plan your own website’s path.
Post-conversion analytics can help you understand activation, retention, and repeat behavior.
Many web analytics tools help you compare new vs returning visitors. The number of new visitors indicates the ability of your site to reach out to new audiences.
On the other hand, returning visitors are usually loyal audiences who are more likely to buy your products/services.
Best Tools for User Journey Analytics
Now, let’s see the best tools for tracking user activities in their journey:
1. WP Statistics
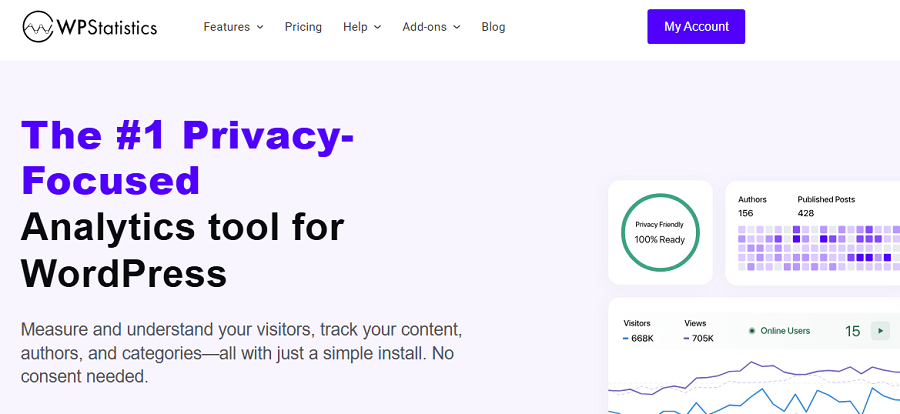
WP Statistics is an analytics plugin that allows you to analyze the user journey on your WordPress website.
You can easily install it on your dashboard and track your site’s performance without leaving it.
Apart from ease of use, WP Statistics offers a strong focus on privacy and data regulation rules, while providing accurate analytics.
WP Statistics provides some dedicated features for user journeys, like Visitor Analytics and Page Analytics.
It offers detailed reports on the performance of entry and exit pages to find your best pages. Also, it lets you define custom events and track goals to have a better understanding of user activities throughout their journey.
WP Statistics might not be as complete as Google Analytics, but it offers some useful features that you can’t natively find on GA4. For example, you can use it to track the performance of authors and find the best writers in terms of traffic and comments.
Overall, WP Statistics is the best combination of accuracy, compliance, and simplicity compared to other user journey analytics tools.
Key Features of WP Statistics
- Visitor journeys and page sequences
- Pageviews and visitors
- Online visitors
- Entry and exit pages
- Traffic sources and channels
- Referrers
- Search-engine traffic
- UTM campaign analytics
- Custom events
- Goals and conversions
- Outbound-link clicks
- File downloads
- Content performance
- Categories and tags
- Author analytics
- Country, region, and city
- Browser, operating system, and device
- Real-time visitor data
- Scheduled reports
- Google Search Console data
Pros of WP Statistics
✅ Privacy-focused tracking
✅ No need for dashboard switch
✅ Free version
✅ Advanced tracking features
✅ Easy installation and configuration
Cons of WP Statistics
❌ WordPress-only
❌ Advanced features are expensive
❌ No heatmaps or session recordings
2. Google Analytics 4
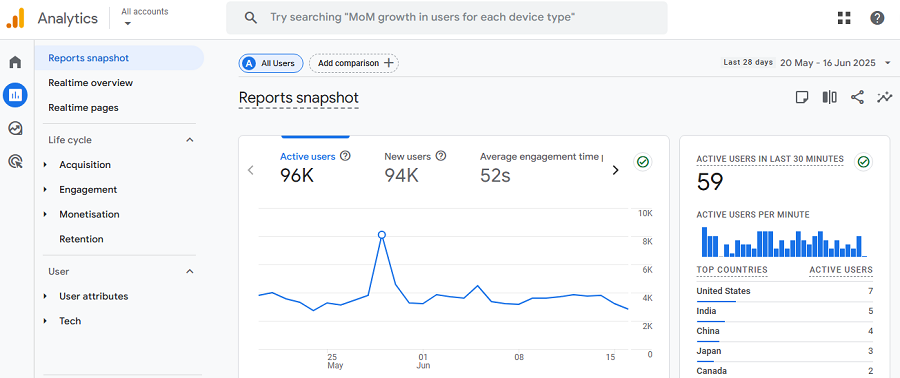
Google Analytics 4 (GA4) is one of the most popular tools for analyzing user journeys and understanding how visitors interact with your website.
Unlike traditional analytics platforms that mainly focus on pageviews and sessions, GA4 uses an event-based tracking model. This allows you to track individual actions, such as pageviews, clicks, scrolls, downloads, form submissions, and purchases.
GA4 also provides dedicated reports for exploring user journeys and identifying the paths visitors take before completing a conversion. You can analyze landing pages, traffic sources, events, and conversions to understand which interactions contribute to your website’s goals.
Another useful feature is the Explorations section, where you can create custom reports such as funnel exploration and path exploration. These reports help you see where visitors enter your website, which pages they visit next, and where they leave.
GA4 is particularly useful for websites that need advanced analytics and integration with other Google products. You can connect it with Google Ads, Search Console, BigQuery, and other tools to build a more comprehensive measurement system.
However, GA4 can be relatively complex for beginners. You may need to configure custom events and reports before you can get the exact user journey data you need.
Key Features of Google Analytics 4
- User journey and path analysis
- Pageviews and sessions
- Events and event parameters
- Engagement metrics
- Landing and exit pages
- Traffic sources and channels
- Campaign and UTM tracking
- Funnel exploration
- Path exploration
- Conversion tracking
- Audience segmentation
- Real-time reports
- Cross-platform tracking
- Custom reports and explorations
Pros of Google Analytics 4
✅ Powerful event-based tracking
✅ Advanced user journey analysis
✅ Completely free
✅ Extensive integrations
✅ Highly customizable reports
✅ Best for omnichannel analysis
Cons of Google Analytics 4
❌ Steep learning curve
❌ Configuration might be difficult
3. Microsoft Clarity
Microsoft Clarity is specifically designed to provide user behavior analytics. Its primary purpose is to show you how visitors interact with your website.
Traditional analytics tools are excellent for measuring traffic and conversions. On the other hand, Clarity focuses more on the visualization of the user journey.
It records sessions and generates heatmaps to show where visitors click, scroll, and interact with your pages.
This is helpful when you want to know why users showed a certain behavior. This is much more useful than tracking what they did on your pages.
For example, it shows visitors frequently click on a place that is apparently clickable. This means there is a functionality problem on your page or a mistake in the UI that makes users think they can click on the item.
If you want a completely free tool to take a look at user behavior on your pages, Clarity is your best choice.
Of course, you can’t rely on it as a standalone analytics tool because it doesn’t offer traditional traffic and conversion metrics.
Key Features of Microsoft Clarity
- Session recordings
- Click heatmaps
- Scroll heatmaps
- Area heatmaps
- User session analysis
- Rage-click detection
- Dead-click detection
- Excessive scrolling detection
- Quick-back detection
- JavaScript error insights
- Conversion insights
- User behavior segmentation
- Dashboard analytics
- Custom filters
- Privacy-focused data handling
Pros of Microsoft Clarity
✅ Free to use
✅ Visual reports
✅ Easy installation
✅ Excellent for UX analysis
✅ Helps identify usability problems
Cons of Microsoft Clarity
❌ Not useful for traditional traffic analytics
❌ Session recordings require manual analysis
❌ Limited features
❌ Not a standalone analytics solution
4. Hotjar
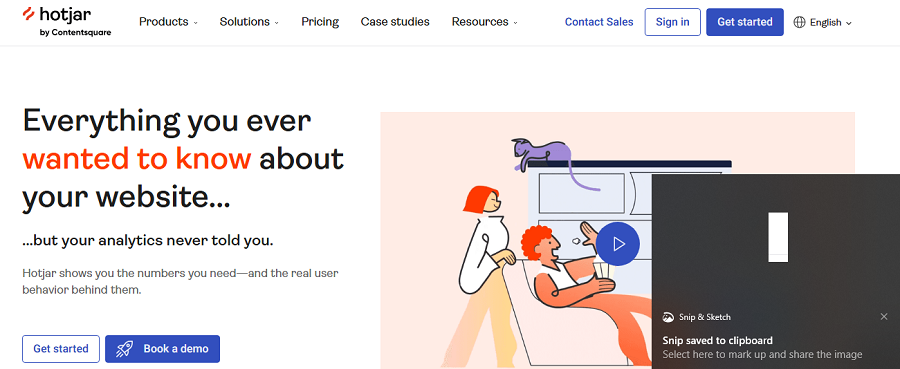
Hotjar is a popular tool for tracking visitor behavior and analyzing user journeys.
It provides both traditional analytics data and user feedback to let you understand what visitors do and why they do it.
It offers useful heatmap reports to show where users click, move their cursor, and scroll on your pages.
This helps you identify popular elements, ignored sections, and potential navigation problems.
Hotjar also offers session recordings to let you watch real user sessions. Playing these recordings allows you to identify friction in the user journey on your site.
Hotjar has a focus on visual reports on user journey, UX, and UI analytics. However, it’s not a complete analytics tool, so you need another tool for tracking metrics like traffic and conversion rate.
Key Features of Hotjar
- Session recordings
- Click heatmaps
- Move heatmaps
- Scroll heatmaps
- User feedback
- Surveys
- Feedback widgets
- Conversion funnels
- User behavior analysis
- Friction-point identification
- Form analysis
- User segmentation
- Custom filters
- Product and UX insights
- Integration with other tools
Pros of Hotjar
✅ Excellent heatmaps
✅ Detailed session recordings
✅ User feedback and surveys
✅ Strong UX analysis
✅ Easy to understand visual reports
Cons of Hotjar
❌ Free plan has limitations
❌ Not a complete website analytics platform
❌ Advanced features are expensive
❌ Large websites need higher-tier plans
5. Matomo
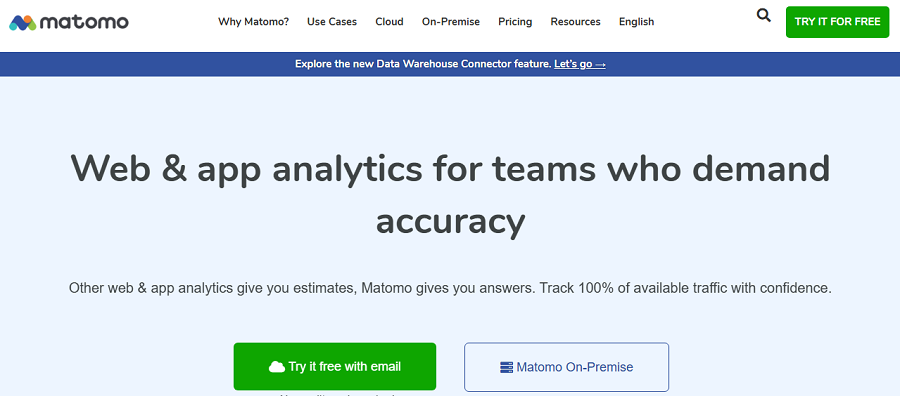
Matomo is one of the most famous GA4 alternatives. It’s a great choice for privacy-conscious businesses that need a web analytics platform with advanced tracking features without using invasive methods.
It allows you to track many details, such as visitors, pageviews, traffic sources, events, goals, conversions, and user interactions throughout your website.
Matomo shows how visitors move from one page on your site to another and how they convert.
Apart from advanced tracking features like heatmaps and session recordings, it ensures privacy and data protection.
Matomo offers both cloud and self-hosted deployments that give you more control over your data.
This is great for organizations that want data ownership and compliance with regulations like GDPR and CCPA.
Matomo is a bit difficult to use, especially for beginners, but it’s perfect for large teams and enterprises.
Key Features of Matomo
- Visitor analytics
- User journey analysis
- Pageviews and visits
- Traffic sources
- Campaign tracking
- Event tracking
- Goals and conversions
- Funnels
- User flow reports
- Session recordings
- Heatmaps
- Form analytics
- E-commerce tracking
- Custom dimensions
- Real-time analytics
- Privacy-focused tracking
- Self-hosted deployment
Pros of Matomo
✅ Strong privacy focus
✅ Self-hosting option
✅ Detailed analytics reports
✅ Advanced user behavior features
✅ Data ownership and control
Cons of Matomo
❌ Technical configuration
❌ Advanced features are expensive
❌ More complex than basic analytics tools
❌ Self-hosting requires maintenance
Here is a quick comparison between these tools:
| Tool | Best For | Main Strength | Main Limitation |
| WP Statistics | WordPress | Simplicity & privacy | No recordings |
| GA4 | Advanced analytics | Events & paths | Complex setup |
| Clarity | UX analysis | Heatmaps & recordings | Limited analytics |
| Hotjar | CRO & UX | Feedback & recordings | Paid advanced features |
| Matomo | Privacy analytics | Data ownership | Higher complexity |
Privacy Concerns When Tracking Visitor Behavior
Naturally, business owners want to collect as many details about visitors as possible, but it means violating their privacy. This is against privacy and data protection laws, especially when you’re collecting personal information from European citizens.
Here is how to stay compliant with these rules while tracking user behavior accurately:
1. Collect Only Necessary Data
You should not collect every piece of information simply because you can collect it. Try to minimize data collection and focus only on the data you actually need for your business goal.
2. Avoid Storing Personal Information
Do not store personally identifiable information (PII) without a clear and legitimate reason. Avoid sending information such as names, email addresses, phone numbers, or other sensitive details to your analytics platform.
3. Use Privacy-Focused Analytics Tools
Choose analytics tools like WP Statistics and Matomo that provide strong privacy management features. Check whether they support relevant data protection requirements like GDPR and CCPA.
4. Get Consent When
If you’re collecting personal information or using intrusive methods like cookies, you have to get consent from users.
It depends on your local rules, audience, and tracking methods. Try to clearly explain what you track and why you track it.
5. Anonymize Visitor Data
Use anonymization features to reduce the amount of PII in your analytics data. For example, anonymizing IP addresses can help you analyze geographic trends without storing the visitor’s full IP address.
6. Be Careful With Session Recordings
Session recordings can reveal sensitive information that users enter on your website. You have to configure session recording tools to mask important data, like:
- Form fields
- Passwords
- Payment information
7. Set Data Retention Rules
You’re not allowed to keep visitor data forever. You need to define a reasonable retention period based on your analytics needs and local regulations. Then, you should regularly review and delete data that you no longer need.
Final Thoughts
Traditional analytics methods focus on key numbers like traffic, sessions, and conversion rate. But for a more accurate analysis of what’s happening on your site, you need to look at the path your users take and their activities. User journey analytics helps you track visitors’ behavior from awareness to the last interaction. Use the right tools to analyze every step in the user journey and find friction and drop-off reasons. WP Statistics, GA4, and Matomo are the best tools for user journey analytics. If you need a privacy-focused tool, Google Analytics can’t be a good choice because it uses cookies and cross-website tracking. If you need more information about user journey tracking, you can contact us.
FAQs
How to track user journeys?
Use user journey analytics tools like Matomo, GA4, and WP Statistics. They help you track visitors from their first interaction to conversion or exit.
What are the 5 stages of a customer journey?
The five common stages are awareness, consideration, conversion, retention, and advocacy.
What is CJA?
CJA stands for Customer Journey Analytics.
What is journey analysis?
Journey analysis is the process of analyzing the steps, interactions, and behaviors visitors take on your website. This helps you identify successful paths, friction points, and drop-offs.