Take your business to next level
Become part of our growing family of +600,000 users and get the tools you need to make smart choices for your website. Simple, powerful insights are just a click away.

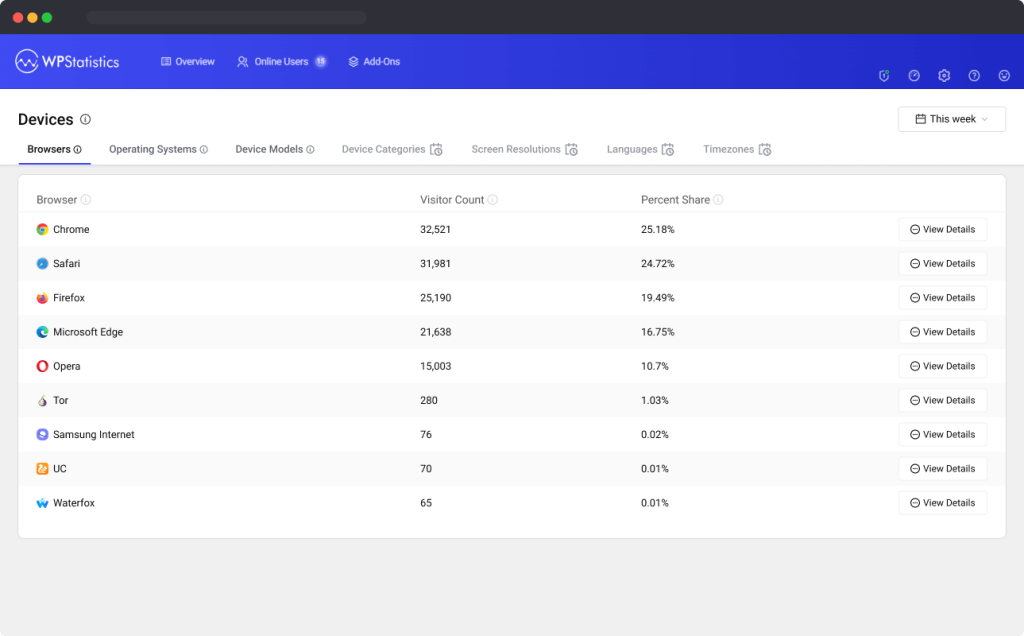
The “Devices” report in WP Statistics is a feature introduced in version 14.8. It includes various sub-reports that provide detailed information about the devices used by visitors to your website.
To access the Devices report, navigate to the WP Statistics plugin in your WordPress dashboard, and under the “Statistics” section, select “Devices.” This section is divided into several tabs, each focusing on different aspects of visitor devices.
The Browsers report provides detailed information about the web browsers used by visitors. Understanding browser usage helps in optimizing website performance and ensuring compatibility. For more details, refer to the Browsers Report Documentation.
The Operating Systems report gives insights into the operating systems used by your visitors. This information is crucial for ensuring that your website functions well across different OS platforms. For more details, refer to the Operating Systems Report Documentation.
The Device Models report lists the specific device models used by visitors. This helps in understanding the hardware preferences of your audience. For more details, refer to the Device Models Report Documentation.
The following tabs will be introduced in upcoming versions of WP Statistics, providing even more detailed insights into visitor devices:
This report will categorize devices into different types such as desktops, tablets, and mobile phones. This categorization helps in understanding the distribution of device types among your visitors.
The Screen Resolution report will provide data on the screen resolutions used by visitors. This information is valuable for designing responsive websites that offer a good user experience across various screen sizes.
The Languages report will give insights into the preferred languages of your visitors’ browsers. This can help in offering localized content and improving user engagement.
The Timezones report will show the geographical distribution of your visitors based on their timezones. This information is useful for scheduling content releases and understanding global audience reach.
Become part of our growing family of +600,000 users and get the tools you need to make smart choices for your website. Simple, powerful insights are just a click away.