
Analyzing your website performance is not just about tracking its traffic. You should go deeper and analyze the quality of your traffic using metrics like bounce rate and engagement rate.
Table of Contents
Both of these metrics let you understand how your visitors interact with your webpages. However, there are significant differences between them that you should consider when tracking your site’s user behavior.
There are misconceptions about bounce and engagement rates that make their interpretation difficult, especially for small businesses.
In this article, we’ll explain the difference between bounce rate vs. engagement rate, and how to interpret them. Also, we’ll introduce the best tools to measure these metrics.
What is the Bounce Rate?
Bounce Rate is the percentage of your website sessions that end without engagement. In other words, it measures how many visitors leave your website without interacting.
The meaning of bounce rate has always been discussed by experts and marketers because interaction can be interpreted differently.
Previously, many tools considered a bounce to be a visitor who viewed one page and then exited without opening another page.
However, with modern tools, like GA4, a visitor can visit only one page and still be counted as engaged.
In fact, staying on a page for several minutes and reading the content is considered engagement even if the visitor leaves the site without clicking another page.
How Is Bounce Rate Calculated?
Let’s break it down and see how an advanced analytics tool like GA4 calculates bounce rate. Look at the following formula, which comes from the definition:
Bounce Rate = (Non-Engaged Sessions / Total Sessions) × 100
In Google Analytics 4, bounce rate is calculated using the opposite of engagement rate. Here is the formula to calculate bounce rate using this assumption:
Bounce Rate = 100% − Engagement Rate
Here is an example of calculating bounce rate:
| Metric | Value |
| Total Sessions | 5,000 |
| Engaged Sessions | 3,800 |
| Non-Engaged Sessions | 1,200 |
| Engagement Rate | 76% |
| Bounce Rate | 24% |
So, bounce rate no longer focuses solely on pageviews. Instead, it shows the percentage of visits where users did not interact with your website.
The meaning of interaction is a controversial concept. A session is considered engaged by GA if any one of the following interactions occurs:
- Duration: The session lasts longer than 10 seconds.
- Pages: The visitor views at least two pages or screens.
- Event: The visitor triggers at least one key event, such as a purchase, sign-up, file download, or contact form submission.
If none of these happen, the visit is classified as a bounce. It’s good to know that you can customize some of them, like the duration threshold.
Look at the following table to understand what is considered a bounce and what is not a bounce
| Visitor Behavior | Bounce | Explanation |
| Reads a blog article for four minutes | No | Time on page is engagement |
| Visits two product pages | No | Multiple pageviews are engagement |
| Purchases a product after 20 seconds | No | Purchase is a key event |
| Leaves after three seconds | Yes | No engagement occurred |
| Accidentally opens the page and closes it immediately | Yes | The session was not engaging |
This approach gives a much more accurate measure of user interaction with your website.
How to Interpret Bounce Rate
You should not interpret bounce rate without considering other metrics. Although bounce rate might show non-engaged sessions, it doesn’t necessarily mean that your content is poor or your SEO strategy needs revision.
Similarly, a low bounce rate doesn’t always show successful content. Look at the following examples to understand why a low bounce rate is not always bad:
In the first example, a visitor lands on a weather page on a website after searching “Today’s weather in Berlin.” The visitor can immediately find the forecast and leave the page in less than 10 seconds because they can easily check the temperature.
This might lead to a high bounce rate, but it’s a successful page because it serves the purpose.
Now, imagine that the visitor lands on an online store and leaves it after 4 seconds because of slow navigation. This is also a bounce, but this time, it’s a signal of a problem with the site.
So, without considering user intent, bounce rate tells only part of the story. Try to consider the type of website and content when interpreting bounce rate:
Here are some examples where a high bounce rate is not a bad signal:
- Informational Blog Posts: Visitors find the answer immediately.
- Recipe Pages: Users start cooking after reading the recipe.
- Dictionary & Glossary Pages: One definition is enough.
- Contact Pages: The phone number, address, or business hours can be easily found.
- Single-Page Landing Pages: Visitors complete the intended action (form, download, call, etc.).
On the contrary, here is a list of situations where a high bounce rate is a warning signal:
- Slow Loading Speed: Visitors leave before the page finishes loading.
- Poor Search Intent Match: Content doesn’t answer what users searched for.
- Weak or Thin Content: Visitors find little value and exit quickly.
- Confusing Navigation: Users don’t know where to go next.
- Poor Mobile Experience: Difficult reading or navigation causes frustration.
- Misleading Title or Meta Description: Visitors leave when the page doesn’t match expectations.
Good Bounce Rates by Website Type
There is no certain formula to determine a good bounce rate for a website. But we can use the bounce rate of good websites as benchmarks to see if our website is performing well.
The following table lists the range of good bounce rates based on the website type:
| Website Type | Good Bounce Rate |
| Blog | 40–70% |
| News Website | 60–85% |
| Ecommerce Store | 20–45% |
| SaaS Website | 25–50% |
| Landing Page | 40–80% |
| Portfolio Website | 35–65% |
| Knowledge Base | 50–80% |
What is Engagement Rate?
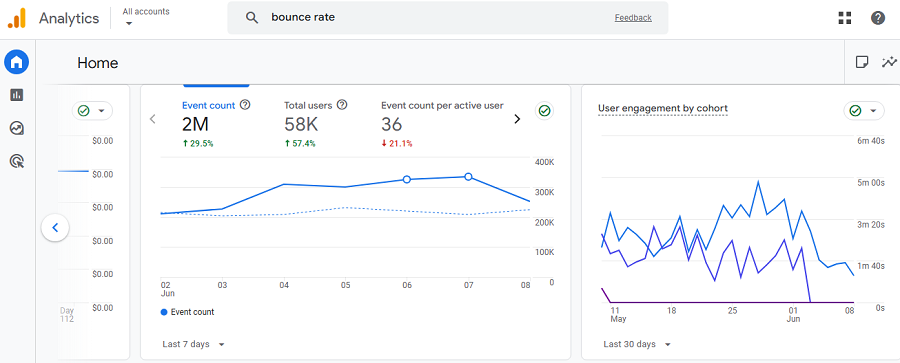
Engagement rate is the percentage of engaged sessions. Again, the definition of an engaged session has changed over time.
An engaged session is a visit that has meaningful interaction instead of simply opening a page and leaving. Engagement rate is a great measure of content effectiveness and user satisfaction.
How to Calculate Engagement Rate?
Engagement rate has a simple formula:
Engagement Rate: (Engaged Sessions / Total Sessions) × 100
For example, imagine you have a website with the following stats:
- Total sessions: 2,000
- Engaged sessions: 1,500
Engagement Rate = (1,500 ÷ 2,000) × 100 = 75%
This means that three out of every four visits have meaningful engagement with your site.
Engagement Time
An important metric related to engagement rate is engagement time. This concept has also changed over time.
Nowadays, engagement time only counts periods when your site’s users are actively viewing one of your webpages.
For example, when they’re reading an article, watching a video, or filling out a form, they’re engaging with your site, and the engagement time is being counted.
If a visitor goes to another browser tab or minimizes the window, GA4 pauses engagement time. Then, if the visitor returns to the page, it will continue counting engagement time.
This is the main difference between traditional analytics and modern tools. In fact, GA4 can recognize if a visitor doesn’t read the article, even if the webpage is open on the browser.
This is a more realistic measurement of user interaction.
Engagement Rate by Website Type
Here is what engagement means for different niches:
- Blogs: Reading articles for several minutes is considered engagement. You have to reach a maximum engagement rate of 60–90%.
- Ecommerce Stores: Viewing products, using filters, adding items to the cart, or starting checkout are true interactions. If you reach a high engagement rate, you can hope for an increase in sales.
- SaaS Websites: Engagement means exploring features, comparing pricing, watching demos, and requesting free trials. If you have a strong engagement, you can interpret it as higher-quality leads.
- Landing Pages: You have to encourage visitors to read the offer, watch a video, submit a form, or click a CTA. Try to measure your success by user interaction, not page views.
Common Factors That Influence Engagement Rate
Here is what you have to consider when analyzing the engagement rate:
1. Content Quality
Content is king, and this is the most important factor for improving your site’s engagement rate.
Try to create helpful, original, and well-structured content to keep visitors naturally engaged.
You need to add engaging elements like videos, images, and graphs. Also, avoid thin or outdated pages because they can’t attract the attention of visitors.
2. Page Speed
Users don’t like slow-loading pages and will immediately leave them. So, if you want to have more interactions, you have to increase the speed of your webpages. Tools like PageSpeed Insights by Google help you understand problems with your site speed.
3. Mobile Experience
Mobile traffic dominates many industries, so you have to pay special attention to your webpage design to be mobile-friendly.
Try to create responsive layouts and touch-friendly navigation to attract visitors. Poor mobile usability usually leads to abandoned sessions and low engagement rates.
4. Internal Linking
Relevant internal links encourage visitors to stay on your site and read more pages. If you have logical internal linking in your blog posts, you can increase both pageviews and session duration.
5. Calls to Action
You have to include compelling CTAs in the right place to encourage visitors to explore more. Make your CTAs clear, relevant, and enticing enough to attract your niche audience.
Here are some of the most common CTAs:
- subscribing
- requesting a quote
- downloading resources
- watching videos
- starting free trials
Bounce Rate vs. Engagement Rate: Key Differences
Now, let’s answer the main question: what is the difference between bounce rate and engagement rate?
In short, bounce rate is the direct opposite of engagement rate. The following table shows more differences between these two:
| Aspect | Bounce Rate | Engagement Rate |
| Definition | % of non-engaged sessions | % of engaged sessions |
| What it Measures | Visitors without interaction | Visitors with interaction |
| Focus | Lack of engagement (negative signal) | Quality of engagement (positive signal) |
| Best For | Finding issues (speed, relevance, UX) | Measuring content quality & user interest |
| Interpretation | Depends on the context. High is not always bad. | Higher is always better. |
| Sensitivity | Sensitive to single-page visits | More realistic |
In fact, bounce rate and engagement rate are complementary metrics. The bounce rate is pessimistic and helps you find issues. On the other hand, engagement rate is an optimistic metric and shows you promising signals about your visitors’ interests.
You should not interpret them without considering other metrics because they might be misleading.
Overall, you can use bounce rate to detect slow-loading pages, poor relevance, or bad UX. Also, use engagement rate to measure your success in content generation and lead quality.
Best Tools to Analyze User Interactions?
Now, it’s time to learn how to analyze the engagement of users on your site. Here are the best web analytics tools that let you see the interactions of your visitors, including bounce rate and engagement rate:
1. WP Statistics
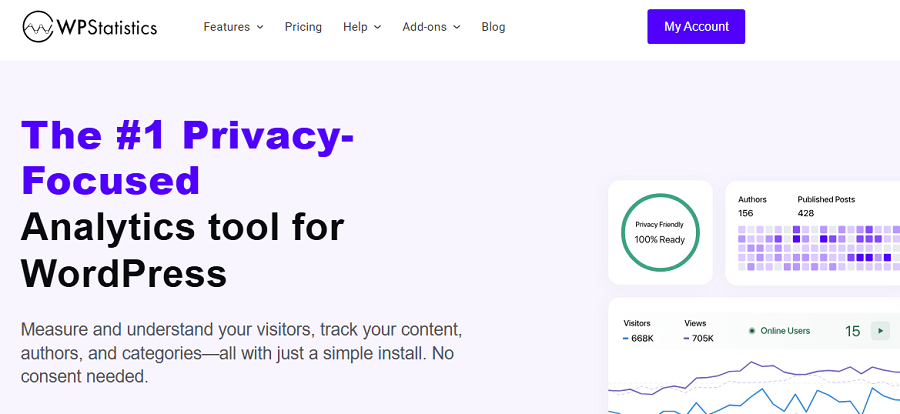
If you’re running a WordPress site, this is your best choice. It offers advanced analytics features directly on your site’s dashboard.
Apart from ease of use, it offers privacy-first services without using cookies or other invasive techniques.
WP Statistics gives you a full picture of visitor behavior on your site to help you find the strengths and weaknesses of your content, design, and navigation.
Although it doesn’t directly provide bounce and engagement rates, you can easily calculate them using the results it gives you.
You just need to go to its visitor insights feature and list the pages with single-view stats. Then, you can export the results to Excel and divide the number of these single-view pages to the total visitors.
Remember that this is a bit different from the definition GA4 uses, but it’s an accurate measure of your pages’ interactions.
Moreover, it gives you entry and exit pages along with author analytics, which are not natively available on Google Analytics.
Look at the key features of WP Statistics:
- Visitor insights
- Single page stats
- Marketing add-ons
- Author analytics
- GSC integration
- Internal search insights
- Geolocation analytics
This is a great tool for small and mid-sized businesses and WooCommerce stores that don’t want to struggle with complex tools.
2. Google Analytics 4
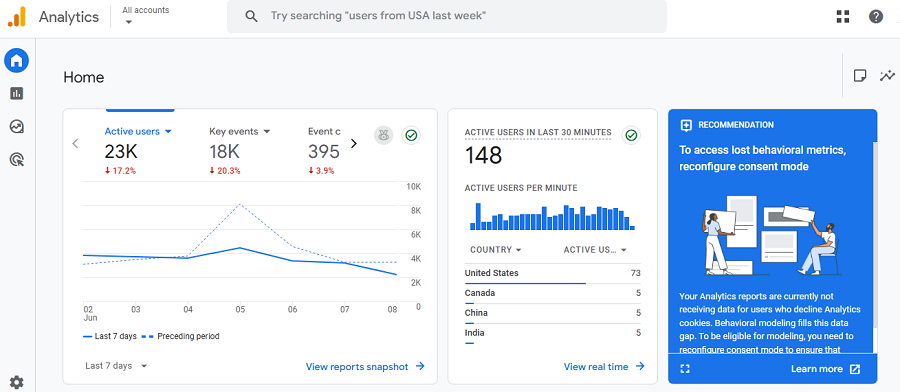
This is the industry standard for website analytics. The new version of Google Analytics doesn’t have the problems of previous versions, including user experience and privacy compliance.
GA4 offers both metrics to let you compare Engagement Rate vs. Bounce Rate. It also offers a great customization feature that enables you to create custom reports.
Here are the key features of GA4:
- Native Bounce Rate and Engagement Rate reporting
- Traffic acquisition analysis
- User journeys and conversion paths
- Event-based tracking
- Audience segmentation
- Google Ads integration
- Free for most websites
Businesses of all sizes that need comprehensive website analytics can use GA4.
3. Microsoft Clarity
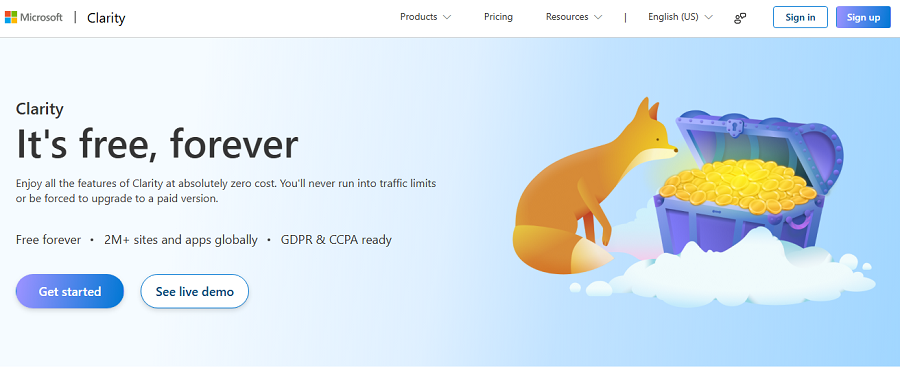
If you want to know why people leave your website without paying for premium tools, Microsoft Clarity is one of the best choices for you.
It doesn’t focus on traditional analytics. Instead, Clarity shows exactly how visitors interact with your pages through session recordings and heatmaps.
In fact, you can watch where users click, how far they scroll, and where they get stuck.
Although it doesn’t calculate bounce rate or engagement rate directly, it integrates with Google Analytics and helps you complement it and interpret its results.
In other words, Clarity is great for understanding the reasons behind the bounce and engagement rates you see on GA4.
It’s completely free, so don’t hesitate to integrate it into your analytics strategy and get deeper insights into your users’ behavior.
Look at the key features of Clarity:
- Free heatmaps
- Session recordings
- Rage-click detection
- Dead-click identification
- Scroll tracking
- Easy GA4 integration
This tool can be useful for almost every site because it’s free!
4. Hotjar
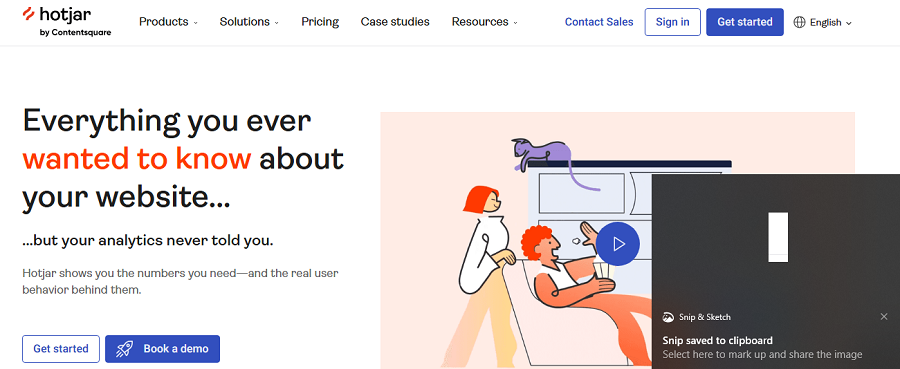
Hotjar is something more than website analytics because it helps you understand how real people experience your website.
You should not check only numbers and charts. Hotjar collects visual data using heatmaps, session recordings, surveys, and user feedback.
This way, you can easily find design problems that might increase your bounce rate and decrease the engagement rate of your site.
It doesn’t report Engagement Rate directly, but it gives you useful data on what visitors did before leaving your site. In other words, instead of checking the number of engagement rates, it shows the quality of interactions on your site.
Its results can be great for modifying your site’s design and content to improve bounce rate and engagement rate.
Here are Hotjar’s key features:
- Click heatmaps
- Scroll heatmaps
- Session recordings
- User surveys
- Feedback widgets
- Conversion funnels
It’s best for marketers and UX designers who want to understand visitor feedback and the reason behind low engagement rates.
5. Matomo
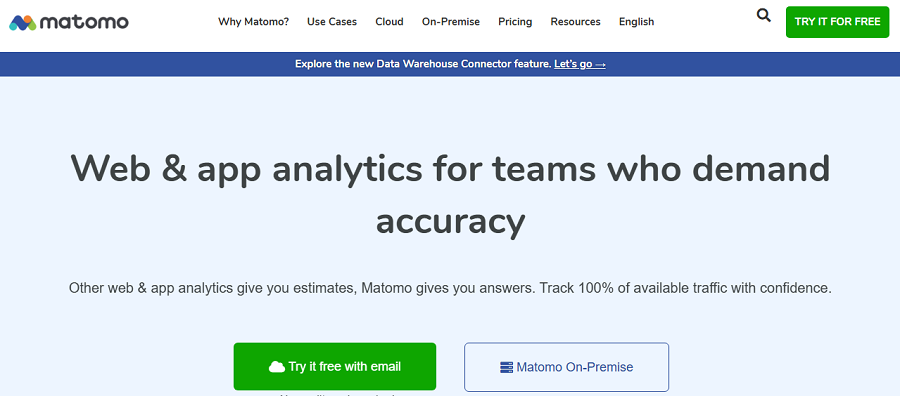
Matomo is one of the strongest privacy-focused alternatives to Google Analytics. It’s an advanced web analytics tool that can be self-hosted and track your site’s performance without using violating methods like cookies.
Matomo provides bounce rate reporting and offers detailed visitor analytics so that you won’t need GA4 at all.
The only drawback is that its interface is not beginner-friendly and requires time to master.
Review its key features:
- Bounce Rate reporting
- Self-hosted deployment
- GDPR and CCPA friendly
- Goal tracking
- Ecommerce analytics
- Complete data ownership
Matomo is best for privacy-conscious organizations and businesses that focus on compliance requirements.
Here is a quick comparison between these tools to choose the best one for your site:
| Tool | Ease of Use | Privacy Focus | Best For |
| WP Statistics | ★★★★★ | High | SMBs and WooCommerce |
| GA4 | ★★★☆☆ | Medium | General website analytics |
| Microsoft Clarity | ★★★★★ | Medium | UX optimization |
| Hotjar | ★★★★★ | Medium | Heatmaps & user feedback |
| Matomo | ★★★☆☆ | High | Privacy compliance |
Conclusion
One of the most important tasks of website owners is to track user engagement on their website.
You have to use the right tool and measure the right metric to have a clear understanding of what your users want on your site. Bounce rate and engagement rate are two great metrics to measure user interactions.
If you have a low engagement rate, you need to optimize your design, content, offer, and CTAs.
Also, if your bounce rate is high, you have to interpret it along with other metrics and find the reason.
You can use page insights, visitor insights, and content analytics features on WP Statistics to make sure you’re interpreting the engagement rate correctly. If you need more info, you can contact us.
FAQs
What is the bounce rate?
Bounce rate is the percentage of sessions that are not engaged.
What is the engagement rate?
Engagement rate is the percentage of sessions with meaningful interactions.
How to interpret bounce rate?
You can’t interpret bounce rate without considering other factors. It’s important to consider the type of webpage and track other engagement metrics.