
What should you check on your website to make sure it’s working well?
To keep your website on top of the search results and reach a high ROI, you have to constantly track its performance.
Web analytics tools give you deep insights into your site’s performance with countless web analytics metrics. Checking all of these metrics is not an efficient approach because it’s really time-consuming and requires several staff members.
That’s why we tried to list the most important metrics that you need to track every week. It’s good to focus on these reports and check other metrics in longer periods.
Here are the top WordPress analytics reports to make sure your website is at its best performance:
1. User Behavior Reports
One of the most important details you need to know about your site is how visitors interact with it.
In fact, you have to know how they find your page, which pages they view, how long they stay, and what they do before leaving.
User behavior tracking lets you know what users find valuable and what they don’t like on your website.
So, you can improve your website’s content, design, and strategy based on user behavior reports.
Here are the top metrics to track user behavior on your WordPress website:
| Metric | What It Shows | How to Use It Weekly |
|---|---|---|
| Page Views | Total pages viewed | Spot popular or weak pages |
| Pages per Visit | Average pages per session | Measure engagement depth |
| Visits | Total user sessions | Track browsing frequency |
| Unique Visitors | Individual site users | Monitor audience growth |
| Hits | Total activity on site | Gauge overall site load |
| Bounce Rate | % of visitors leaving after one page | Find weak or misleading entry pages |
Among these, Pages per Visit is the most important metric you have to check weekly. It’s the number of pages a visitor sees during a visit, which is a great way to measure the engagement level.
If you check the pages per visit on your site every week, you can understand if your visitors are interacting with various pages or leaving the site without engagement.
Of course, you need to interpret the result alongside other metrics to find the weaknesses and strengths and optimize your site accordingly.
2. Page Insights
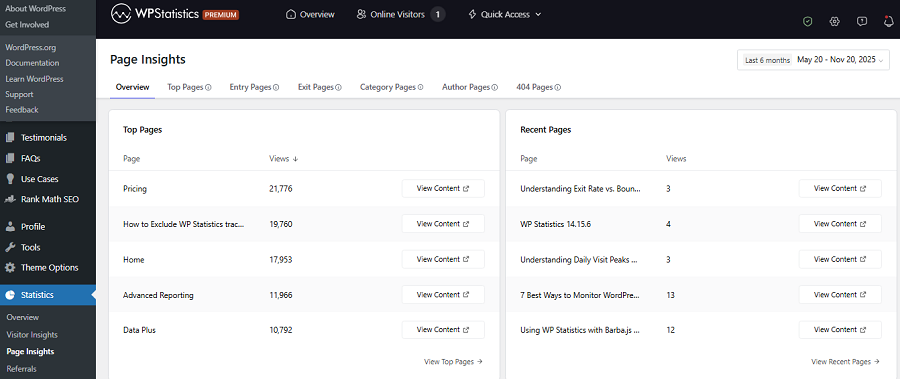
You have to track the best and worst performing pages on your site to see what appeals more to your visitors.
When you understand which pages attract the most attention, you can optimize your content and design to increase your visits.
So, you have to check page insights reports weekly to track metrics, like:
- Page Views: Number of times each page is viewed
- Unique Page Views: Distinct visitors per page
- Time on Page: User engagement duration
- Entry Pages: First pages users visit
- Exit Pages: Where visitors leave
Among these metrics, you’d better focus on entry/exit pages reports to find the best pages that attract users and the pages that make users leave your site.
3. Location Reports
You must know where your visitors are located to be able to optimize content type, publishing time, marketing campaigns, and many other factors.
Location reports show in which countries, regions, or cities most of your visitors live. The country metric, in particular, is the most crucial metric you have to consider in your weekly reviews.
4. Device Reports
To improve user experience on your site and optimize your page design for all devices, you need to see which type of device most of your visitors use.
Website design, graphic design, and many functionalities are dependent on the device your users use to visit your site, from desktop to tablet or mobile.
Here are the metrics you have to check in your weekly device reports:
| Metric | What It Shows | How to Use It Weekly |
|---|---|---|
| Device Type | Desktop, tablet, or mobile usage | Prioritize responsive design |
| Screen Resolution | Display size variations | Adjust visuals and layouts |
| Bounce Rate by Device | Exits by device type | Spot usability issues |
| Browser | Chrome, Edge, Firefox, etc. | Create plugins/add-ons for your service |
5. Traffic Source Analytics
Traffic source reports let you know how visitors find your website. In fact, using this report, you can see if your users have come to your site from search engines, social networks, referrals, or direct access.
This data helps you understand which marketing channels are best for your website and where you have to invest.
Here is a summary of what traffic sources resorts tell:
| Metric | What It Shows | How to Use It Weekly |
|---|---|---|
| Organic Traffic | Visitors from search engines | Strengthen SEO strategy |
| Referral Traffic | Clicks from other websites | Measure outreach effectiveness |
| Direct Traffic | Visitors typing your URL | Track brand awareness |
| Social Traffic | Users from social media | Evaluate social campaigns |
The most valuable traffic source to review weekly is organic traffic, because it shows how well your content ranks in SERPs. It’s an indicator of long-term and healthy growth for your website.
6. Content & Keyword Performance
As said earlier, organic traffic is the most important channel you have to consider. The keyword performance of your content is key to improving your organic traffic.
That’s why you have to include monitoring content and keyword performance in your weekly reports.
When analyzing your content performance, you can consider important metrics, like top queries, pages with the highest traffic, and pages with more referrals from relevant sources.
Top keywords tell you what your visitors have searched on Google when they have found your content.
Content performance reports let you align your content with your audience’s intent and get better results.
7. Author Performance
To have constant growth in the long term, you have to work with professional authors to generate informative and optimized content for your website.
It’s so important that you have to continuously track their performance. If multiple authors are contributing to your website’s blog, you have to compare their performance to find the best authors to assign important posts.
Here are the metrics you can analyze your authors’ performance weekly:
- Posts per Author
- Views per Author
- Avg. Engagement
- Bounce Rate per Author
8. Technical Reports
Even if you generate the best content possible and offer great services, technical issues on your site can prevent customers from purchasing.
So, it’s essential to check technical reports every week to get insights into your site’s health, speed, and performance.
Here are the most important metrics you have to consider in technical reports:
| Metric | What It Shows | How to Use It Weekly |
| Page Load Time | How fast do pages load | Optimize for better UX |
| Server Response Time | Hosting performance | Detect server slowdowns |
| 404 Errors | Missing or broken pages | Fix links immediately |
| Uptime | Site availability rate | Ensure consistent accessibility |
| Non-index pages | Pages that are indexed by Google | Find the issues of the non-index pages |
Among these issues, the page speed or load time is really important. You must make sure that your pages load quickly on all devices. Otherwise, many customers will leave your site, especially those with internet limitations.
9. Search Queries Reports
Ranking keywords are among the most important metrics you have to check constantly. This helps you understand what keywords have been successful in the SERPs and brought visitors to your site.
This way, you can get new ideas for your future content strategy and also find the problems with keywords that don’t rank well.
Apart from the position of keywords in the SERPs, you have to check other metrics like clicks, impressions, and click-through rate (CTR).
These metrics show the visibility rate of your content and the interaction of the internet users with it. Using the result, you can find if your titles and snippets are working well.
10. Backlink Reports
Off-site SEO is an important part of every SEO strategy for sites of all sizes and types. The main purpose of off-site SEO is to increase the domain authority of your site through various tactics, especially backlinks from relevant websites.
The backlink profile of a website is a key indicator of its authority within its niche. You have to build a strong backlink-building strategy to make your website’s backlink profile stronger compared to its competitors.
Checking backlink reports is also essential to make sure your backlink strategy is working well. The key metric you have to check in backlink reports is the number of referring domains. It’s the number of unique websites that link back to yours, which shows your website’s authority and trust.
Try to monitor your referring domains to detect any lost links and contact the domain admins to ask why your link has been deleted.
Moreover, you can check other metrics like the type of backlinks, including do-follow, no-follow, sponsored, etc.
It’s also good to compare your backlink profile with your competitors’ and reach out to the websites where they have backlinks.
Looking for a Solution to See Weekly Reports on WordPress?
Now that you know what you have to check every week, it’s time to learn how to do that. Many website owners will typically go for Google Analytics as the most famous web analytics tool.
However, it comes with some drawbacks, including:
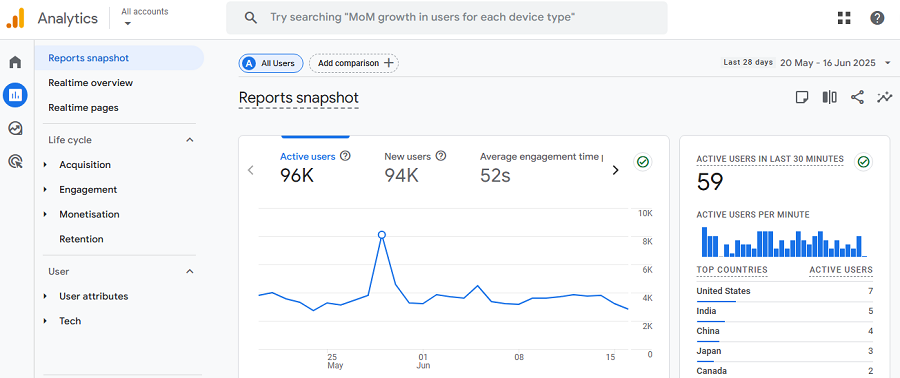
- Complex setup & learning: Google Analytics can feel confusing, especially for beginners. Many site owners can’t find metrics easily on their dashboard. Although GA4 has tried to reduce this problem compared to previous versions, it’s still a complex platform. So, it’s not a user-friendly platform for weekly usage.
- Limited visibility inside WordPress: Although plugins like Site Kit allow you to see GA4’s reports on your website, you have to leave your WordPress to see full reports.
- Privacy and data ownership concerns: One of the biggest concerns of website owners regarding GA4 is that it stores a lot of personal data and shares it with third-party tools for marketing. This has raised issues about data privacy and compliance with regulations like GDPR.
Fortunately, other analytics solutions tackle these problems. If you’re running a WordPress website, you can use website analytics plugins like WP Statistics to check weekly reports without leaving your website.
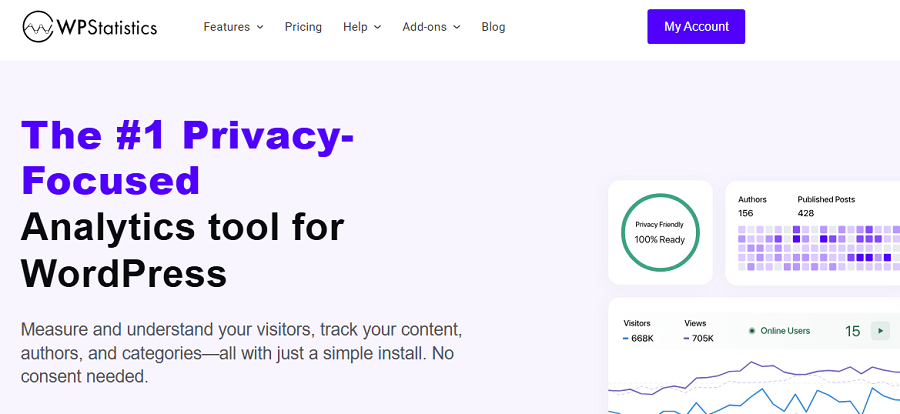
WP Statistics is one of the best WordPress reporting tools that can be easily installed on your website. Then, you have all the reports on your dashboard without having to switch to other tools.
More importantly, it stores data locally and doesn’t share anything with third-party tools. As a result, you don’t need cookie banners on your website.
The good news is that it can track many metrics that GA4 doesn’t cover by default. For example, it lets you track the performance of your writers. It can also integrate with Google Search Console for tracking each single page’s performance and top search queries.
So, don’t waste your time struggling with GA4’s complex dashboard. Try WP Statistics for free, and if you like, check paid add-ons for more advanced analytics reports.
Conclusion
To have a successful website, you need to constantly track its performance. It helps you detect weaknesses and optimize your strategy accordingly.
The thing is that you might not have the time to check all the metrics, so it’s good to focus on the important weekly reports that are vital to your website’s performance.
We reviewed several key reports you need to check every week. These metrics show you any possible malfunctions on your site and give you the chance to tackle the problem before it gets worse.
To save time in this process, you’d better use an analytics tool on your dashboard rather than going to a third-party platform. WP Statistics combines simplicity and accuracy in a user-friendly dashboard on your WordPress website.
You can check important weekly reports on it without having to leave your control panel. If you want to get familiar with its capabilities, you can install it for free or request a demo.
FAQs
How to check Analytics in WordPress?
You can easily install a plugin like WP Statistics on your dashboard and check many analytics metrics for free.
How to schedule reports in GA4?
In GA4, use the “Reports Snapshot” section and select the report you want to schedule. Then, you can click the Share button in the top right corner and schedule an email for the report.
What are the 6 basic reports of Google Analytics?
Google Analytics provides a complete set of reports, but the most important metrics you can check using this tool are: Real-Time, Audience, Acquisition, Behavior, Conversions, and Custom reports.
What are the 5 regular reports?
You usually have to check Overview, Location, Traffic Sources, Content, and Goals. These are available on almost all analytics tools.
What’s the best alternative to GA4 for weekly WordPress analytics reports?
WP Statistics is the best Google Analytics alternative. It tracks lots of useful metrics for free and offers advanced add-ons at an affordable cost.