Are you using time on page analytics in your strategies?
Traffic is not the only important metric in web analytics. You need to track your users’ behavior to optimize your website design and content planning according to what they like.
One of the best metrics that shows how your users behave is to track where your users spend more time. Time on page and similar metrics give you insights into what appeals most to your audience.
In this article, we’ll let you know what time on page is and how you can track and analyze it to improve your site’s performance.
What Is Time on Page?
Time on page is the average duration visitors spend on a specific webpage on your site.
It shows how long your content can hold users. In fact, time on page is a behavioral metric and is really important to determine how engaging your content is.
Consider the following example for a travel blog to understand what time on page is:
A visitor searches for a specific keyword on Google and finds a blog post on your site. He/she lands on your post about “The Best Beaches in Bali,” and reads it for two minutes.
Then the user might click an internal link and go to another article about “Top Bali Hotels,” and read it for 1 minute. Finally, he/she decides to check a fact on the first page again and spends 1 more minute on it, and then leaves your site.
So, the time-on-page metric for the first article is three minutes, and for the second article is 1 minute.
Now, we understand how to calculate the average time on page for each webpage:
Average Time on Page = (Total time users have spent on a page) / (Total number of views)
Of course, you need to consider two important factors when calculating the average time on page:
- Time difference: You must calculate the time difference between page views.
- Important note: You should not record the time for the exit page and for single-page sessions.
Sometimes, website owners mistake time on page with other metrics like session duration and bounce rate. Here is a quick summary of their key differences:
- Time on Page tells you how long someone stayed on a single page.
- Session Duration shows how long the user engaged overall.
- Bounce Rate indicates whether the user is engaged at all.
Why Track the Average Time on Page for Your Website?
You might ask why you need to know how long users stay on your pages, apart from tracking the traffic of your site.
Here are the benefits of knowing the average time on page:
1. Measuring Content Engagement
The most important benefit of tracking the average time on page is understanding the engagement level of your visitors with your content.
A higher time on a page usually means that people are interested in the content and want to spend more time reading, watching, or interacting with it.
2. Evaluating Content Quality & Relevance
Time on page helps you understand if your content is what users expect. If your content is relevant and provides what visitors want, they spend significant time on a page.
In other words, a high time on page says your topic, structure, tone of voice, and visuals are suitable.
For example, a user searches for “how to improve SEO on WordPress,” and comes to your blog post. If they stay on your page for several minutes, they have found your content useful.
It should be noted that if they’re looking for a specific detail, they might find it soon and leave your site. So, a bounce or a low time on page is not a bad signal in this case.
3. Identifying User Intent & Satisfaction
Different pages have different purposes. For example:
- Blog posts: Informing people
- Product pages: Persuading people to buy
- Landing pages: Converting people to loyal customers
When you monitor the average time on a page, you can understand if your pages match the user intent. For example, if they stay for a long time on your checkout page, there must be a problem with the process.
4. Improving SEO Performance
Time on page is not a ranking factor, but search engines indirectly reward pages with a high time on page.
In fact, time on one page is similar to dwell time, which is the duration it takes a visitor to return to search results from a page. The dwell time is an important metric, and a high dwell time shows the relevance and usefulness of the content.
So, a blog post with a four-minute average time on page and a low bounce rate ranks better compared to a page with a 20-second time on page.
5. Optimizing Conversion Funnels
Time on page shows how effectively your content can guide visitors toward your goals. Pages that can draw the attention of users more usually have better conversion rates.
6. Enhancing User Experience & Site Design
The average time on page is usually related to the site’s design, formatting, and overall user experience.
For example, a low time on page can show UX problems, including:
- Slow load times
- Hard-to-read layouts
- Poor mobile responsiveness.
7. Tracking Progress Over Time
If you monitor the average time on page for a long period, you can understand if your content strategy and website design work well. This is actually a great test to check whether your optimization has been successful.
The Best Time on Page Analytics Tools
It’s good to use web analytics tools that provide details about the time users spend on your site, along with other important metrics.
Here are the best tools that offer time on page analytics:
1. WP Statistics

WP Statistics is a great web analytics plugin that can be easily installed on your WordPress dashboard.
It gives you almost everything you want to analyze your website’s performance, from content analytics, visitor analytics, and even author analytics.
It offers lots of analytics features for free and provides advanced add-ons, like real-time, data plus, and marketing, for affordable prices.
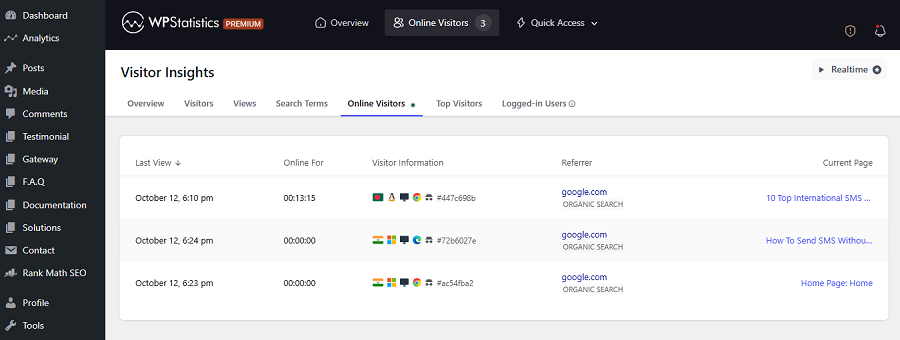
The plugin gives you useful details about online visitors, including the duration your visitors have been on your website.
This gives you the ability to track your users’ behavior and the performance of your website in real time.
The most important aspect of WP Statistics is that it’s GDPR-compliant by default, which means you don’t need to use cookie banners on your site.
2. Google Analytics 4 (GA4)

Google Analytics 4 is the industry standard for web analytics. It uses an event-based tracking model and offers more insights than just pageviews.
You can use GA4 to track engagement data such as scrolls, clicks, video plays, and active session time.
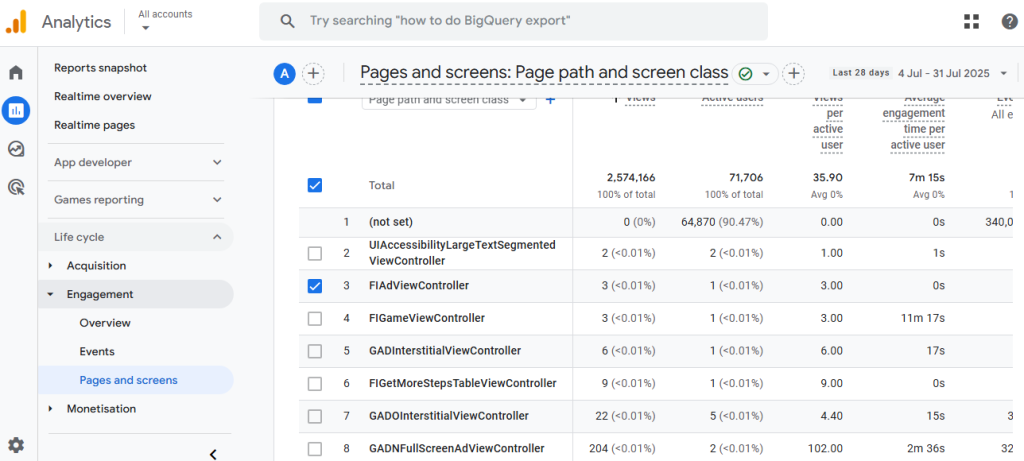
However, you need to know that GA4 doesn’t show the traditional “time on page” metric. It shows Average Engagement Time.
In fact, it measures how long users interact with a page. It also shows Average Online Active User Engagement Time.

3. Hotjar
Hotjar gives you a complete picture of user experience by tracking metrics like time on page.
It also shows useful heatmaps, session recordings, and on-page feedback tools to help you analyze your website. Hotjar displays where your users spend time and why they behave the way they do.
4. Matomo
Matomo is also a powerful open-source analytics platform. It offers privacy-first tracking services and lets you track detailed metrics, including time on page, engagement rate, and user flows.
You can consider it a full suite of analytics similar to GA4. However, it’s a bit complex to use, just like Google Analytics.
5. Plausible Analytics
Plausible Analytics is a lightweight analytics tool that gives you privacy-focused tracking services. Using this tool, you can have a clear and accurate Time on Page metric.
It’s famous for simplicity and transparency, but it doesn’t offer advanced analytics features. You can count on it for tracking essential engagement insights without using cookies.
Look at the following table to compare these tools:
| Feature | WP Statistics | GA4 (Google Analytics 4) | Hotjar | Matomo | Plausible Analytics |
| Primary Focus | WordPress site analytics | Advanced behavioral tracking | UX visualization | Full-scale web analytics | Lightweight privacy analytics |
| Time on Page Metric | ✅ Online Visitors Time on Page | ✅ Average Engagement Time | ✅ Page duration tracking | ✅ Standard Time on Page | ✅ Active Time on Page |
| Platform Type | WordPress plugin | Web + App | Web only | Web + App | Web only |
| Real-Time Tracking | ✅ Yes (live visitors) | ✅ Yes | ⚪ Limited | ✅ Yes | ⚪ Basic |
| Heatmaps / Recordings | ❌ | ❌ | ✅ | ✅ (add-on) | ❌ |
| Data Ownership | ✅ Full (stored locally) | ❌ Google servers | ❌ Cloud-based | ✅ Full / Self-hosted | ✅ Full / No cookies |
| Ease of Use | ✅ Very easy | ⚪ Moderate–Complex | ✅ Easy | ⚪ Moderate | ✅ Very easy |
| Privacy / GDPR | ✅ Built-in compliance | ⚪ Requires consent setup | ⚪ Partial | ✅ Full | ✅ Full |
| Pricing Model | Free + paid add-ons | Free | Freemium | Free / Paid plans | Low-cost subscription |
| Best For | WordPress users | Marketers & analysts | UX & CRO teams | Privacy-focused orgs | Bloggers & SMBs |
What’s a Good Average Time on Page for Your Website?
If you want to interpret the average time on page for your website, you have to compare it with your competitors.
Look at the following table to see what the average time on page is for websites in different niches:
| Industry | Typical Avg Time on Page |
| General | ~ 54 seconds |
| B2B | ~ 82-83 seconds |
| Travel / Hospitality | ~ 60 seconds |
| Automotive | ~ 59 seconds |
| Financial Services | ~ 54 seconds |
| Grocery / Energy | ~ 44 seconds |
| Apparel / Fashion | ~ 45 seconds |
Try to compare your website’s average time on page with these benchmarks and optimize your strategy to reach them.
Of course, you should not interpret the average time on page without considering other metrics. Here are some tips for creating a data-driven strategy according to the average time on page and other metrics:
1. Low Time on Page + High Bounce Rate
When visitors leave your site immediately, you have to work on your content to meet their expectations.
Try to recheck your content strategy and consider relevance, readability, and user experience.
Remember that your content should answer the user’s search intent. Then, you can tweak headings, design, CTA, and your internal linking strategy
2. High Time on Page + Low Conversion
Sometimes people read and browse your website content, but do not complete your goals, like signing up, buying, or contacting you.
This means that your content is informative but not persuasive enough to encourage them to take the next action.
To fix it, you need to add contextual CTAs within your content. For example, you can use general CTAs like “Learn more,” “Start free trial,” and “Compare plans”.
Try to improve conversion cues and clearly state the benefits, and take advantage of testimonials. Remember that the user experience and the simplicity of completing your goal are really impactful.
3. Short Time from Certain Traffic Sources
Sometimes you see the average time of users who come from certain channels, like paid ads or social media.
In this case, the problem is not your page itself. Here are some possible reasons:
- Misleading or vague ad copy.
- Broad audience targeting, instead of laser-targeting.
- Poor landing page alignment with the ad message.
So, you have to align your landing page with the ad intent and target relevant users rather than running bulk campaigns.
4. High Time on Page + High Bounce Rate
Sometimes a page has both a high time on page and a high bounce rate. This might seem contradictory, but it is not.
It can mean that every time a user visits the page, they find exactly what they need and leave the site without visiting other pages. This is especially normal for informational blog posts.
Of course, you can take some measures to encourage users to click and read other related blog posts on your site. However, this is not necessarily a bad signal.
6. Moderate Time on Page + High Conversions
This is the perfect balance for almost all types of content and for all businesses. Don’t worry if your average time on page is below industry standards when your conversion rate is suitable.
It shows that users are finding what they need quickly and taking action. This is exactly what you want, and it shows your website is optimized well.
For example, if you have an eCommerce checkout page, a 30-second average time might sound low. However, if it converts 15% of users, that’s an excellent signal of efficiency.
Conclusion
Time on page is an important metric to track the behavior of your users and find possible problems in your website. It helps you detect issues in CTAs, content, navigation, internal linking, and user experience.
Various tools show different metrics that are close to time on page. For example, WP Statistics lets you understand the time online users have spent on your site.
Also, GA4 tracks the average engagement time, which is more detailed than other tools.
Try to interpret time on page alongside other metrics, like bounce rate and exit rate, to find the weaknesses and strengths correctly. You can always count on our help if you need more information about your website analytics.
FAQs
What is time on page in web analytics?
Time on page measures how long a visitor spends actively viewing a specific page before moving to another or exiting the site. It’s an indicator of user engagement and content effectiveness.
Does GA4 measure time on page?
Not directly. GA4 uses Average Engagement Time, which measures the time users actively interact with a page (scrolling, clicking, or keeping it in focus), offering a more accurate picture of engagement than the old “time on page” metric.
Does WP Statistics show time on page?
Currently, WP Statistics only shows online visitors’ time on page.


