Learn how to track and compare exit rate vs. bounce rate.
Analyzing a website’s performance isn’t all about traffic and ranking keywords. You must analyze some more details to understand your audience behavior better and optimize your strategies accordingly.
One of the most important metrics you need to consider is their behavior on exit and entry pages to see what appeals more to them.
That’s why you have to track the exit rate and the bounce rate to understand what changes your website needs to keep your visitors engaged.
In this blog post, we’ll explain the differences between exit rate and bounce rate and the way you have to track and interpret them for your website.
What Is the Exit Rate?
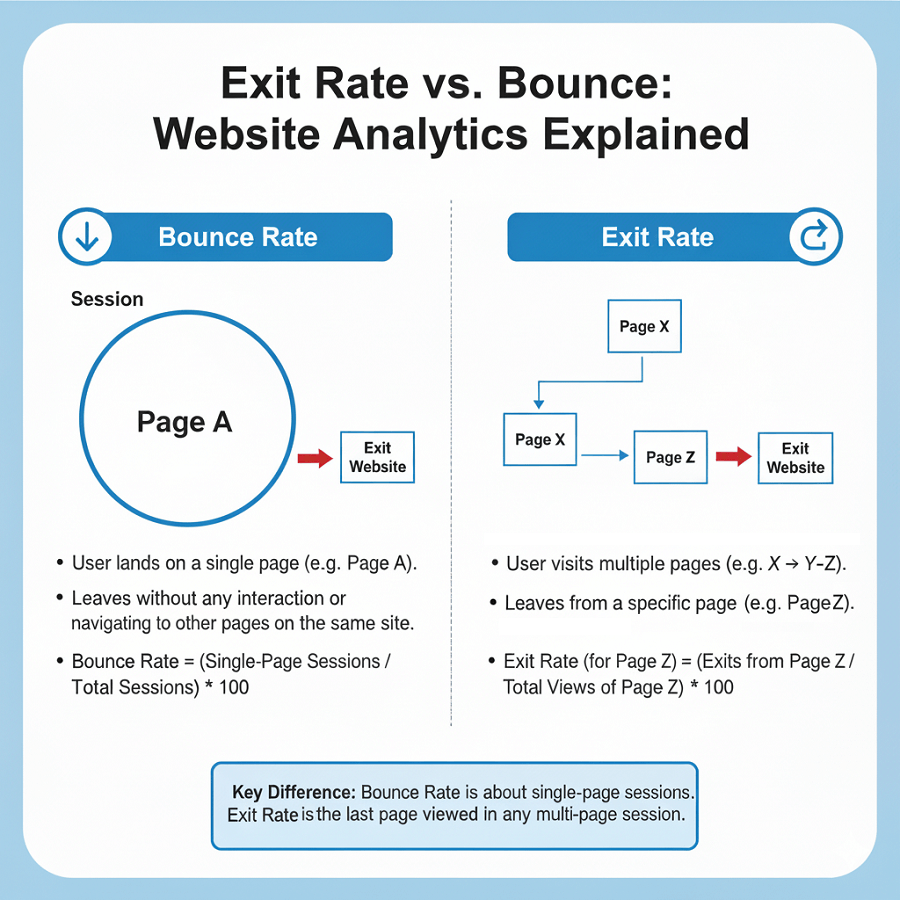
Exit rate measures how many times users leave your website after visiting a particular page. In simple terms, it’s the percentage of sessions that end on that page.
Imagine a visitor comes to your website from a Google search. They start reading a blog post, then they might browse your product category, click on a specific item, and then leave.
The last page is the exit page of that user, because that’s where he/she has left your site, regardless of how many pages they have viewed beforehand.
You can calculate the exit rate of a page using the following formula:
Exit Rate = (Number of exits from a page ÷ Total views of that page) × 100
So, if your product page had 1,000 total views and 300 of those sessions ended there without visiting any other pages on your site or clicking any link, the exit rate would be 30%.
Exit rate is a valuable metric because it’s an indicator of where your audiences leave your site. A page with a high exit rate on a page where you expected an interaction can be a bad signal. For example, a blog post or a pricing page with a high exit rate should be optimized.
Of course, a high exit rate isn’t always bad, because you sometimes expect an exit. For example, “Thank You” or “Order Confirmation” pages usually have a high exit rate because visitors have completed their goals.
So, interpreting the exit rate depends on other factors, like the context, user intent, page type, and funnel position.
What Is the Bounce Rate?
Bounce rate tells a different story. It measures the percentage of single-page sessions. In fact, bounce rate focuses on the users who land on a page and leave without visiting other pages on your site.
Imagine a user finds your blog post using Google search and reads it. Then, he/she leaves your site without doing anything, like clicking on another article, signing up, or going to your menu. That’s a bounce, and the bounce rate measures the percentage of users who read just one page:
Bounce Rate = (Single-page sessions ÷ Total sessions starting on that page) × 100
A high bounce rate is not necessarily a bad signal.
Sometimes, it might mean the content wasn’t engaging or relevant enough. In this situation, the content can’t encourage visitors to visit other pages on your site.
But sometimes, it might mean that the visitor has found exactly what they were looking for. In this situation, a bounce isn’t a failure; it’s an accomplishment.
So, if you want to interpret the bounce rate on your site, you need to consider the context and the intent.
For example, a high bounce rate on informational blog posts can be normal because the users have found the answer to their questions.
However, a high bounce rate on a landing page is a bad signal, so you have to try to remove the problem, like a weak call-to-action.
Exit Rate vs. Bounce Rate: Key Differences
As we mentioned, both metrics focus on visitors who leave your website. Many site owners and marketers confuse these two metrics when analyzing their website’s performance. However, their meanings and applications are fundamentally different.
Here is a quick overview of the differences between exit rate and bounce rate:
- Bounce Rate: “Did the visitor interact beyond the first page?”
- Exit Rate: “Where did the visitor choose to leave?”
In fact, bounce rate tracks entry behavior and lets you know what happens when a visitor lands on a page. It’s important to know whether the visitor decides to check other pages or leave the site.
On the other hand, the exit rate focuses on the leaving behavior and tracks the pages where users decide to leave your site. In sum, we can say that every bounce is an exit, but not every exit is a bounce.
If you want to learn more about the differences between bounce rate and exit rate, look at the following table:
| Item | Exit Rate | Bounce Rate |
| Focus | Exit page | Entry engagement |
| Sessions | Multi-page allowed | Only single-page |
| Calculation | Exits ÷ pageviews | Single-page ÷ visits |
| Behavior | Session end | No more clicks |
| Shows | Page drop-off | Landing page impact |
| Where | Any page | First page only |
| High Rate Means | Friction or completion | Weak engagement |
| Example | Leaving after 3 pages | Leaving after 1 page |
| Action | Improving flow | Improving content & CTA |
| Funnel Insight | Exit points | Entry success |
Overall, these two metrics complement each other. The bounce rate helps you determine weak landing pages, and the exit rate lets you detect pages that make people leave your site. So, you need to consider both of them when analyzing your site.
How to Track Your Website’s Exit & Bounce Rates
Now, let’s learn how to track exit rate and bounce rate for your website. First, it’s good to get familiar with the best tools that can track these metrics:
| Tool | Key Features | Ideal For | Pricing |
| WP Statistics | Simple setup, privacy-focused analytics, bounce rate insights | WordPress site owners | Free / Premium |
| Google Analytics 4 (GA4) | Real-time tracking, user journey visualization, event-based data model | Marketers & SEO professionals | Free |
| Matomo | GDPR-compliant, on-premise option, detailed exit analysis | Privacy-conscious teams | Freemium |
| Clicky Analytics | Heatmaps, real-time data, bounce tracking | Small businesses | Paid |
| Plausible Analytics | Lightweight, privacy-first, minimal bounce tracking | Simpler sites & blogs | Paid |
We’ll now provide a step-by-step guide to tracking exit rate and bounce rate using WP Statistics and GA4:
Use WP Statistics to Track Exit Rate and Bounce Rate
WP Statistics is one of the best WordPress plugins for tracking website performance. It offers lots of free metrics plus some advanced add-ons that provide detailed insights, some of which are not even offered by Google Analytics.
Here is how to track exit rate using this plugin:
- Install: Follow these steps to install it: Plugins → Add Plugin → search WP Statistics → Install → Activate.
- Basic setup: Go to WP Statistics’ Settings → General and set site timezone and tracking options.
- Enable Data Plus: Go to the Data Plus page on WP Statistics’ site, choose a plan, and enable it.
- Exclude internal traffic: Filter your own IP so that you track the real interactions. To do that, go to WP Statistics’ Settings → Exclusions → add your IPs and admin roles.
- Open Page Insights: In the WP Statistics menu, click Page Insights and find Exit Pages. Now, look at the Exit Rate and sort the pages to find the best and worst-performing pages.
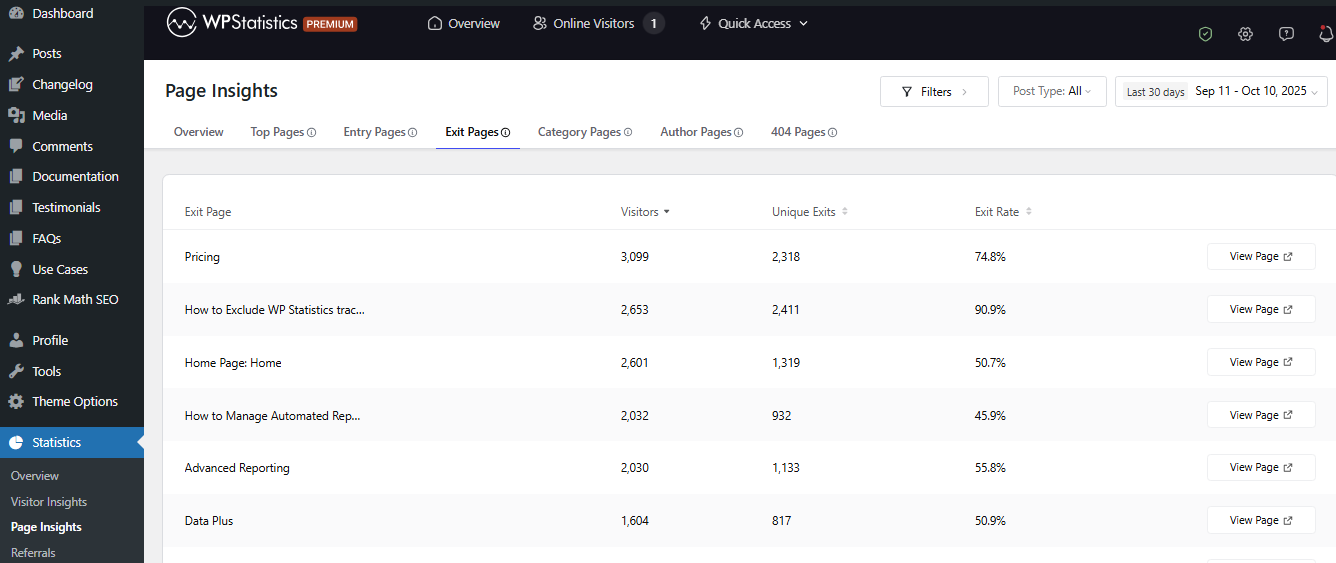
WP Statistics doesn’t directly show the bounce rate, but you can use Entry/Exit page reports to find pages with high/low bounce rates.
To do that, go to Visitor Insights and click Visitors to view the visitors’ journey from Entry to Exit pages. In fact, if the “Total Views” of a visitor is 1 and their Entry and Exit pages are the same, they can be considered bounces.
To calculate their total number, you can easily export the result using the Optimization section → Data Export menu. In this menu, you need to choose visitors as the target data and a suitable format.
Then, you can sort the visitors to find those with a single view to find pages with bounces. After that, you have to count the number of bounces on each page and find the pages with the highest bounce rates.
Use Google Analytics 4 to Analyze Exit & Bounce Rate
Although GA4 has raised privacy concerns, it’s still the most important web analytics tool.
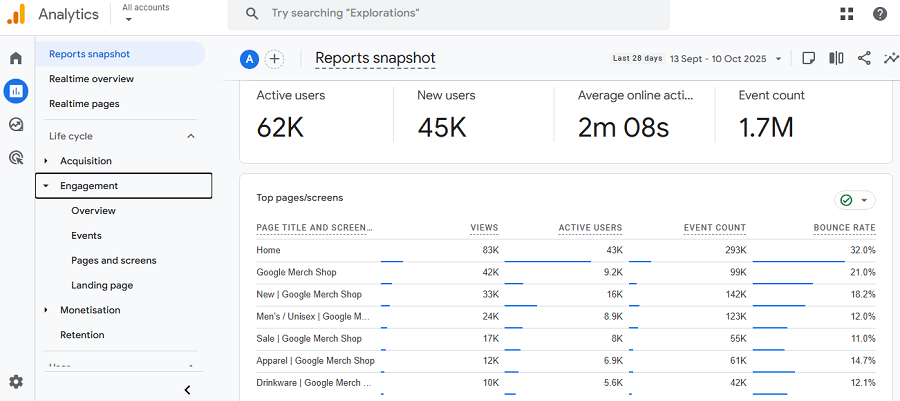
Here is how to track bounce rate using Google Analytics 4:
- Create a property on GA4: Use your Google account to create a property on GA4 and connect your website to it using Site Kit.
- Engagement view: Go to Reports → Engagement and watch the bounce rate of your website’s pages.
GA4 doesn’t have a native feature to show Exit rates. So, you need to create a customer report. Here is how:
- Go to Explore
- Create a Blank report
- Add Dimension: Page path + query string
- Add Metrics: Views, Exits.
- Drag Page path to Rows
- Drag Views & Exits to Values
Now, the table shows counts. You just need to export the result to calculate the exit rate.
How to Interpret the Results
As said earlier, high or low exit/bounce rates are not necessarily good or bad. You have to interpret the result according to the context and intent.
The following table helps you interpret the results of exit and bounce rate tracking for your website:
| Result | Reason | Meaning | Solution |
| High Bounce + Short Time | Lack of relevance, slow load | Users leave fast | Fix speed & content match |
| High Bounce + Long Time | Good info | Users got an answer | Add links or CTA |
| Low Bounce + High Exit | Drop-off later | End of journey | Add next-step prompt |
| High Exit (Mid-Funnel) | Confusing UX, weak CTA | Users quit early | Test flow & CTAs |
| High Exit (Final Page) | Natural close | Goal complete | No fix |
| Low Exit + Low Bounce | Good flow | Strong engagement | Keep layout & content |
| Exit/Bounce Spike | Bug, campaign issue | Data anomaly | Check setup & sources |
| High Exit on Blog | Normal info read | Satisfied users | Add related posts |
From Website Analytics to Social Media Growth
Bounce and exit metrics reveal valuable behavioral patterns that go beyond your website. They can guide your content creation efforts on social networks like LinkedIn. With LinkedIn AI tool such as MagicPost, you can easily convert your website insights into targeted and engaging LinkedIn posts, helping you grow your presence with content that you already know performs well.
Conclusion
Exit and bounce rates show different user behaviors on your website. The first one tracks the pages where users decide to leave your site. The second one monitors the pages that don’t encourage people to visit other pages on your site.
If you learn how to interpret these behaviors, you can optimize your page design, content, CTA, etc.
Try to consider the page purpose, user intent, and audience segmentation to interpret them correctly.
Using tools like WP Statistics and GA4, you can easily track these metrics and optimize your website.
FAQs
What is the difference between exit rate and abandonment rate?
Exit rate is the percentage of visitors who leave a page after visiting it. On the other hand, the abandonment rate measures the percentage of users who leave your site before completing a goal, like checkout.
What is an exit rate?
The exit rate of a page is the percentage of users who leave that page without going to other pages of your site.
What is the opposite of bounce rate?
The opposite of bounce rate is engagement rate. It’s the percentage of users who continue to interact with your site and visit other pages.
Is a high exit rate good or bad?
It depends on the context. A high exit rate is bad if users leave too early. However, it can be fine if it’s the last step of a procedure on your site, like purchasing.