
WP Statistics helps you track top entry pages and exit pages on your website.
Web analytics is a critical task for website owners as they need to measure the performance of their site to know its weaknesses and strengths.
You might be familiar with web analytics metrics like traffic, locations of users, or ranking keywords. However, if you want to outperform your competitors, you need a more professional analysis with more complex metrics.
One of the most important metrics in web analytics is entry/exit pages, as it shows where your users enter your site and where they leave it.
In this blog post, we’ll explain why you need to find top entry pages and exit pages on your website and how to do that using tools like WP Statistics and GA4.
What Are Entry Pages and Exit Pages?
First, let’s see what exactly the entry and exit pages are.
What Are Entry Pages?
These are the first pages visitors land on when they come to your website. Think of them as digital front doors — where your user’s journey begins. These pages are often optimized for search engines, ads, or social media links.
What Are Exit Pages?
Exit Pages, on the other hand, are the last pages users view before leaving your site. They represent the end of a visitor’s session, whether it’s after completing a goal or bouncing before engaging further.
Understanding both gives you a clear window into how people interact with your site and where you might be losing them.
Why Tracking Entry and Exit Pages Matters
Tracking entry and exit pages helps you understand your users’ behavior. Here are some of the benefits of entry/exit page tracking:
- Optimizing User Flow: You’ll find what content attracts visitors and which pages make them leave your website.
- Content Performance: It helps you evaluate specific pages that retain users or push them to convert.
- Identify Weak Points: Exit pages that have high bounce rates have two negative signals. So, you must look for irrelevant content or any other problems in these pages.
- Improve SEO Strategy: You’ll understand the best landing pages with higher organic traffic. So, you can focus more on them and optimize your site’s SEO strategy.
- Boost Conversion Rates: You can optimize your users’ flow and lead them from entry pages to your product pages to increase conversion rates.
Tools to Track Top Entry Pages and Exit Pages on Your Website
Let’s compare some of the best tools for tracking entry/exit pages on your website:
| Tool | Best For | Custom Reports | Privacy Focused | Simplicity | Cost |
|---|---|---|---|---|---|
| WP Statistics | WordPress-only, simple analytics | Limited | Yes | Easy | Free/Paid |
| GA4 | Advanced, multi-channel sites | Extensive | Needs config | Hard | Free |
| Matomo | Privacy-first, compliance-heavy | Moderate | Yes | Moderate | Free/Paid |
| Clicky | Real-time, easy-to-use tracking | Basic | Yes | Easy | Free/Paid |
To choose one of these tools, you must know more about them. Here are some more details about these web analytics platforms:
1. WP Statistics
As it comes from the name, WP Statistics is specifically designed for WordPress websites. It’s one of the best plugins that provides analytics directly in the WP dashboard.
It’s a great choice for users who want basic insights without using third-party tools. WP Statistics allows you to track your visitors in real time.
It also offers entry and exit page reports that allow you to optimize your landing pages. Another great feature is country and referral tracking while staying compliant with GDPR.
Here are the pros and cons of WP Statistics:
| Pros of WP Statistics | Cons of WP Statistics |
| Easy to install and use Data stored locally Privacy-friendly Lightweight for basic needs No need for a Google account | Less detailed than GA4 Advanced features might be expensive |
2. Google Analytics 4
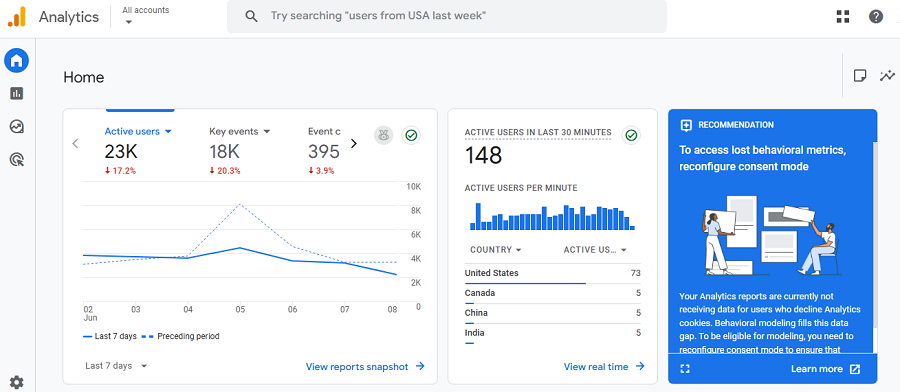
GA4 is the latest version of Google Analytics and is the most famous web analytics tool in the world.
Its approach is event-driven tracking and provides a deep level of user behavior tracking. Here are some of its features:
- Real-time reports
- Integration with Google Ads, Search Console, and BigQuery
- Customizable explorations (funnels, pathing)
- Cross-device and cross-platform reporting
| Pros of GA4 | Cons of GA4 |
| Free and powerful Highly customizable Deep insights Advanced segmentation Ideal for ecommerce, SaaS, and content-heavy sites | Steep learning curve Requires configuration for accurate reporting (events, conversions) Limited historical data retention unless upgraded |
3. Matomo

Matomo is another great privacy-focused web analytics platform that provides entry/exit page reports.
It can be self-hosted or used via the cloud and is often used by organizations that have concerns about data ownership and compliance.
It also offers great heatmaps and session recordings that provide great insights into your website performance.
| Pros of Matomo | Cons of Matomo |
| Full data ownership and control More privacy-focused than GA4 Similar UI to Universal Analytics (UA) Rich set of features (free & paid) | Self-hosting requires technical setup Advanced features are expensive Complex setup for beginners |
4. Clicky Analytics
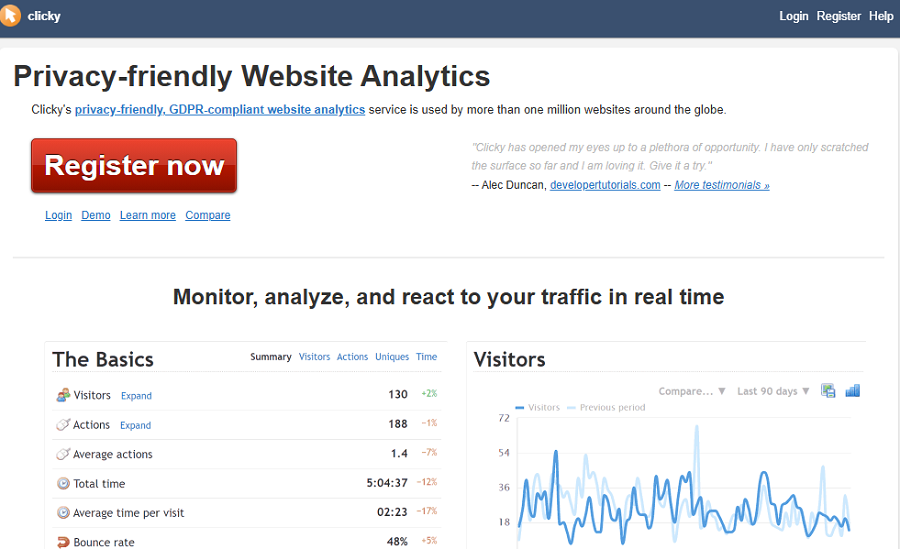
Clicky is a real-time web analytics tool that’s famous for its simplicity. It offers an intuitive interface and accurate entry and exit page tracking.
It’s great for real-time analytics and measuring metrics like bounce rate, time-on-site, and referrer tracking.
Look at the pros and cons of this tool to see if it’s suitable for your site:
| Pros of Clicky | Cons of Clicky |
| Easy to understand and navigate Strong real-time reporting Good balance between depth and simplicity Privacy-friendly with EU data center options | Limited advanced features compared to GA4 Some features (like heatmaps) require a paid plan Fewer integrations than other major platforms |
Using WP Statistics to Track Entry Pages and Exit Pages
WP Statistics is a powerful yet user-friendly WordPress plugin that gives you on-site analytics without relying on third-party services like Google Analytics.
It’s especially handy for users who want to avoid cookies or external data sharing. Here’s a more in-depth walkthrough:
Step 1: Install the WP Statistics Plugin
The installation process is really straightforward. You just need to log in to your WordPress admin panel and go to Plugins > Add Plugin.
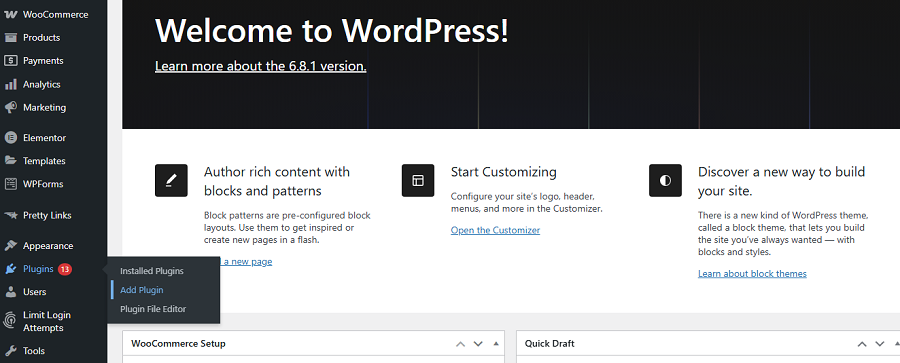
Search for “WP Statistics” in the search bar and click Install Now. After installation, click Activate to finalize the process.
Step 2: Configure the Plugin
Now, you need to set up the plugin and customize your reports according to your requirements.
Follow the process below:
- Go to WP Statistics > Settings.
- Go to the General tab.
- Enable Track Logged-In User Activity to track visits.
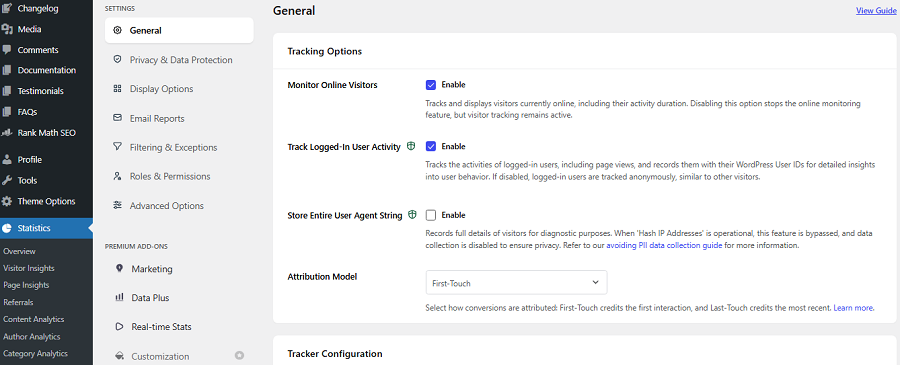
Also, you’d better exclude your own IP address or admin visits to have a more accurate report. To do that, you can go to the Exclusions tab.
Step 3: View Entry and Exit Page Reports
Now, to analyze entry pages and exit pages, you must go to WP Statistics > Page Insights.
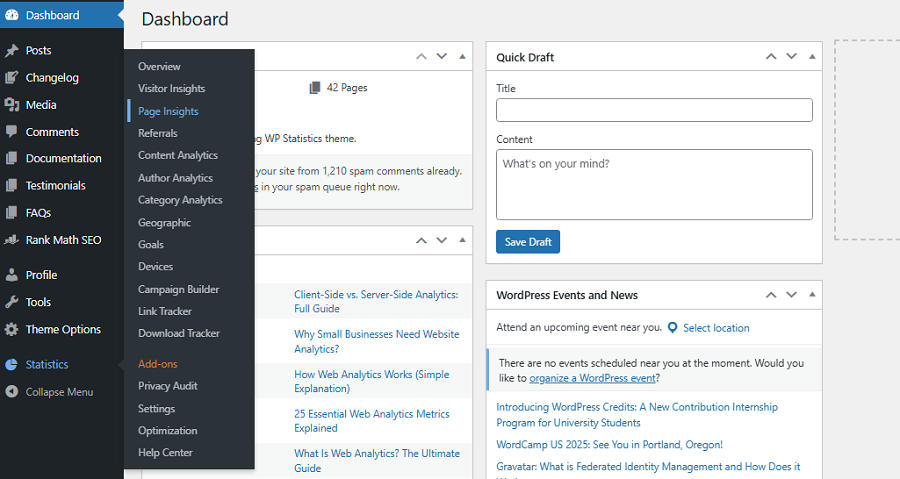
Here you’ll see some important reports, including:
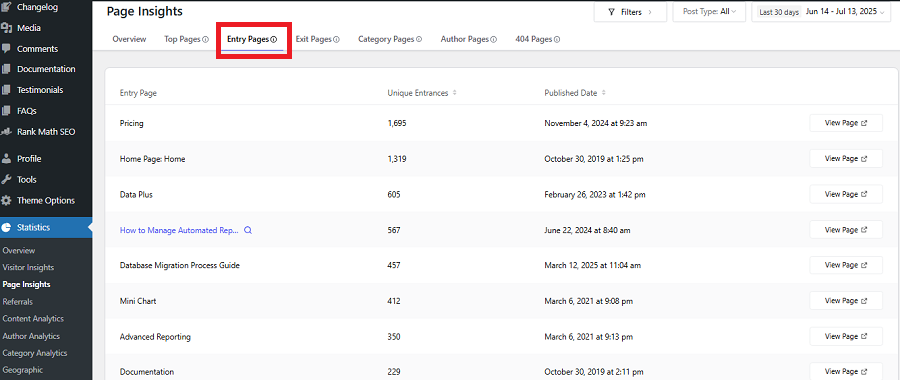
- Top Entry Pages:
- Top Exit Pages:
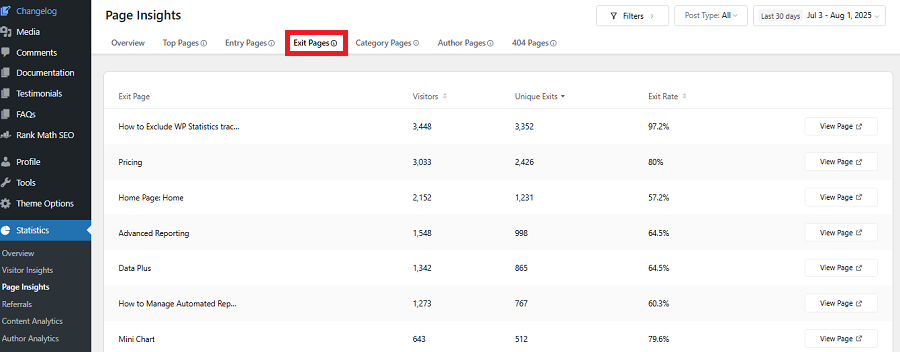
Each row of the report includes the Page URL and the number of entries/exits. A great feature is that it shows the Exit Rate of each URL to let you know their performance.
Moreover, you can click on each URL to analyze it more deeply and check metrics like:
- Entry Page: The number of times this content was the first page visited in a session.
- Exit Page: The number of times this content was the last page visited before the session ended.
- Bounce Rate: Percentage of single sessions that was began and ended on this content.
- Exit Rate: Percentage of total views that ended on this content.
WP Statistics allows you to filter the results or change the period you want to track the entry or exit pages.
Entry/Exit Page Analysis Using Google Analytics (GA4)
GA4 uses the term “Entrances” to represent the number of times a page on your site was the first page of a session.
Here is how to track entry pages and exit pages using GA4:
Step 1: Create Your GA4 Property
First, you must create a property on your Google account:
- Visit analytics.google.com
- Log in and select your GA4 property.
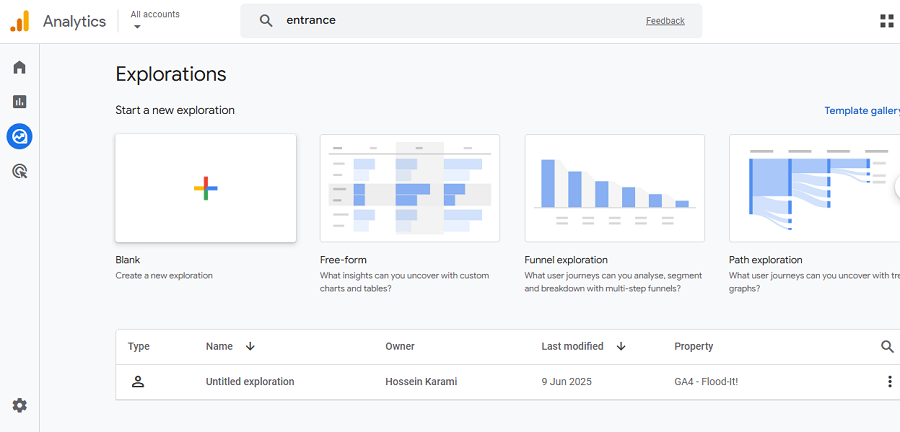
Step 2: Create a Custom Exploration Report
In your GA4 property, click Explore in the left-hand navigation menu. Then, select Blank (Free-form) to start a new exploration.
Step 3: Add Dimensional Data
Click the + icon next to Dimensions and then import the following items and press Confirm:
- “Page path and screen class”
- “Page path + query string”
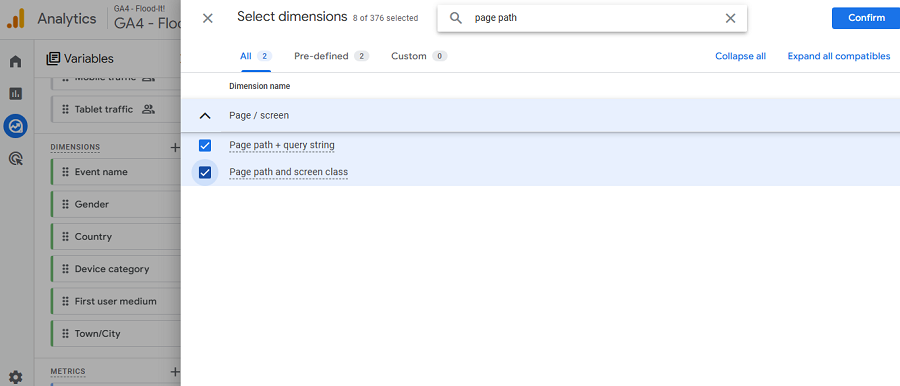
Then, drag these dimensions and drop them in the ROWS section in the next column.
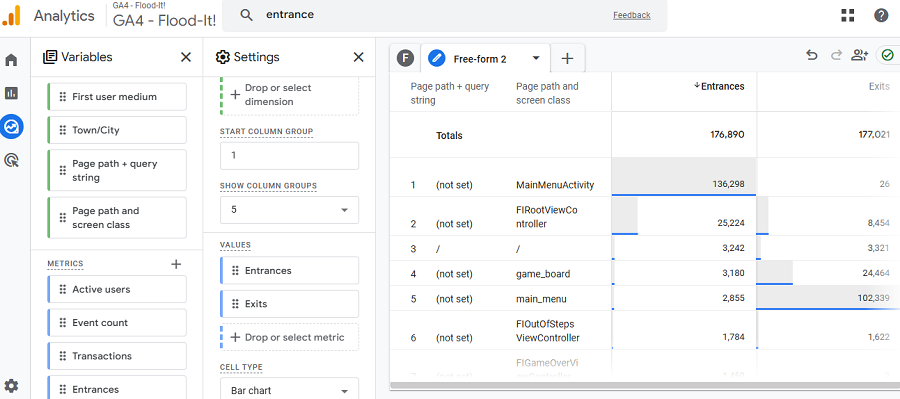
Step 4: Add Metrics
Now, you should add the metrics you want to measure. So, click the + icon next to Metrics and import the following items:
- Entrances (for entry page count)
- Exits (for exit page count)
After that, you must drag these items and drop them in the VALUES section.
Now, GA4 creates a table that shows the top entry and exit pages. You can click the Exits/Entrances column headers to sort descending and view your top exit pages.
Tips for Interpreting the Entry/Exit Page Report
We can categorize entry-exit page results in the following table:
| Low Exit Rate | High Exit Rate | |
| High Entry Rate | Engaging Landing Page | Drop-Off Landing Page |
| Low Entry Rate | Overlooked Content | Content Dead-End |
Here is what these four results mean and what to do:
- Engaging Landing Page: This means that visitors enter and stay, which is the best possible performance. The page has a good UX and relevant content. You can still enhance CTAs or guide deeper to improve the result.
- Drop-Off Landing Page: When users leave quickly after arriving, it might mismatch the users’ expectations. You need to review the relevance and work on the load speed or redesign it.
- Overlooked Content: Your page is rarely used as an entry, which means it doesn’t rank for any keyword. However, it retains users, so you just need to consider minor SEO optimization.
- Content Dead-End: Users rarely find your page, and if they do, they leave it soon without going to other pages. So, you need to optimize its content in terms of relevance and SEO, and also add internal links. You also need to revise the CTA and make the page more attractive.
Conclusion
Analyzing entry pages and exit pages is essential for understanding user behavior and optimizing its SEO performance. You can use tools like WP Statistics and Google Analytics to track entry pages and exit pages. The good news is that WP Statistics has a ready-to-use entry/exit page report, while you must create a customized report on GA4. Also, you don’t need to switch your WordPress dashboard when you want to track your top-performing entry pages or analyze exit pages for user behavior. You also need to learn how to interpret the results. Try to consider entry/exit page results along with other metrics like bounce rate or engagement rate to find a deeper understanding. You can also count on our help if you need more details about analyzing your website’s performance.
FAQs
How to see exit pages in Google Analytics?
In GA4, go to Explore > Free-form. Then, add “Page path” as a dimension, and “Exits” as a metric to see exit pages.
What is the landing page and exit page?
A landing page is the first page a user sees in a session. An exit page is the last page they view before leaving.
How to find the most visited pages of a website?
In GA4, go to Reports > Engagement > Pages and screens to see the most viewed pages by “Views” or “Users.”
What are the entrances and exits in GA4?
Entrances show how often a page starts a session. Exits show how often a page ends a session.