What web analytics metrics do you use to track your site’s performance?
Web analytics lets you collect data from your website’s visitors and analyze it to find your site’s weaknesses and strengths. Then, you can optimize your strategies to improve your customer experience, rank better in SERPs, and increase your sales.
The question is, what metrics do you have to focus on more to have a better understanding of your performance?
In this blog post, we’ll introduce the most essential web analytics metrics to help you save time when tracking your performance. Also, we’ll compare top web analytics tools like WP Statistics to let you know which tool is better for each metric.
Traffic Metrics in Web Analytics
Traffic metrics tell you how many people are coming to your website and where they’re coming from. This data helps you measure growth, see how well your marketing is working, and understand your audience better.
1. Pageviews
Pageviews are one of the most important metrics in web analytics. In fact, one of the main purposes of creating a website is to have people view your content.
So, if you want to know if people are visiting your content, you must track the pageview of your web pages.
Pageviews of your site are the total number of times people load your web pages on their browsers. In other words, if someone visits your homepage and then clicks on two blog posts, it will be three pageviews.
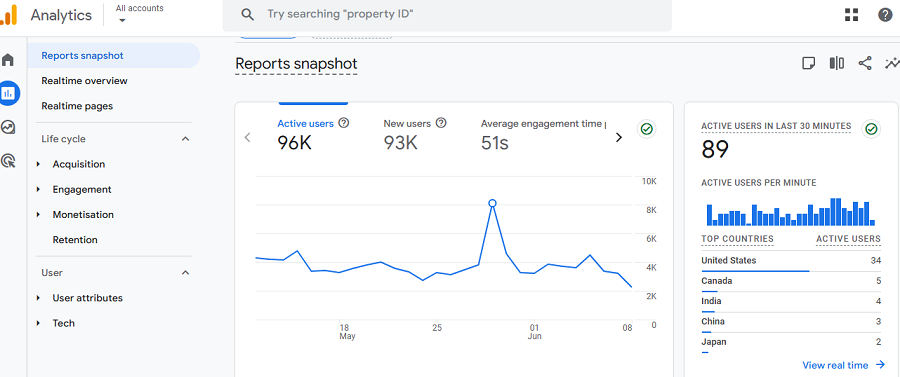
Web analytics tools count the total pageviews of your website during given periods. Here is a screenshot of Google Analytics that shows views of a sample site:
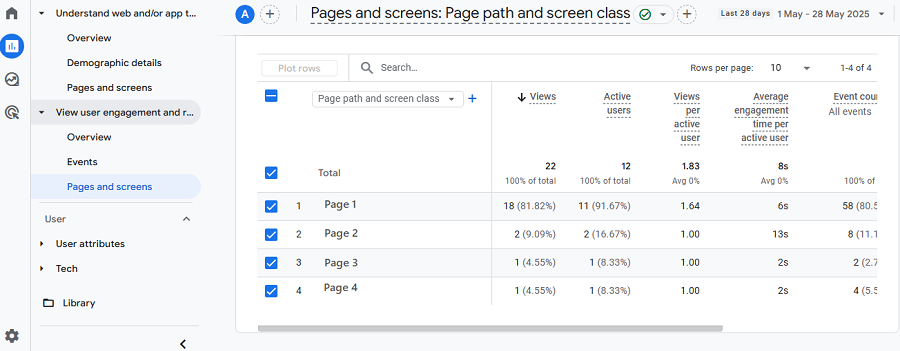
You can see that the site has been viewed 22 times in the last 28 days.
High pageviews mean your content is interesting and well-optimized. So, you have to look for spikes and trends in your pageviews and recognize which page drives more traffic to your site.
Also, you need a benchmark to compare your site’s views against a successful website, especially your competitors.
Although standard pageviews are different across different industries, you can consider the following benchmarks:
- Small blogs: 1,000–10,000/month
- Growing content sites: 10,000–100,000/month
- Established publishers or businesses: 100,000+
The median value is 8.82K per month.
2. Unique Visitors
Unique visitors are the number of different individuals who have visited your website during a specific time period. This is a key metric in web analytics because it shows how many actual people are behind your pageviews.
This number removes repeated visits by the same person, so you understand the actual size of your website’s audience. In other words, if someone visits your homepage five times a week, it’s still just one unique visitor for that period.
The thing is that web analytics tools track unique visitors using browser cookies and device information. This is not perfectly accurate due to privacy settings, ad blockers, or device switching. However, it’s still a reliable web analytics metric for audience measurement.
You must be careful when interpreting unique visitors to your website. High unique visitor numbers might mean more people are coming to your site, which is good. However, if you see your unique visitors are increasing without engagement, you need to think of the reason why you can’t hold visitors.
So, you shouldn’t just look at this number alone. Compare with other metrics, including pageviews.
As a benchmark for unique visitors to your website, you can consider the following table:
| Website Type | Benchmark: Monthly Unique Visitors |
|---|---|
| Small Personal Blog | 500 – 5,000 |
| Niche Content Site | 5,000 – 20,000 |
| Growing Small Business Site | 20,000 – 50,000 |
| Medium-Sized Publisher | 50,000 – 200,000 |
| Established E-commerce Site | 100,000 – 500,000+ |
| Large Media/Corporate Site | 500,000 – 1,000,000+ |
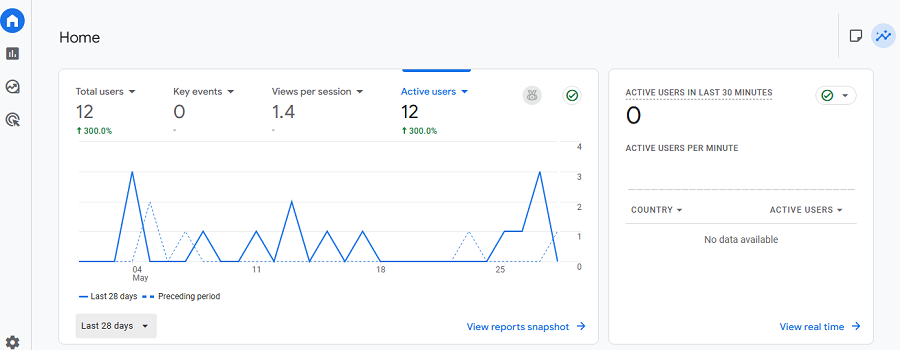
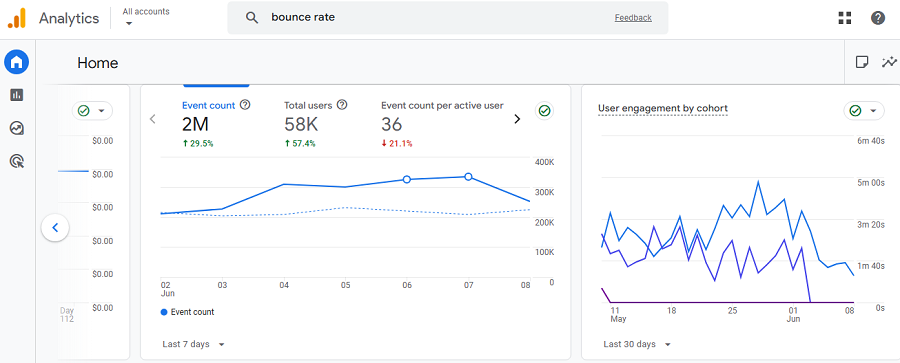
Remember that different web analytics tools might use other names for this metric. For example, GA4 uses “Total users” instead of unique visitors. Take a look at the following sample:
3. Traffic Sources
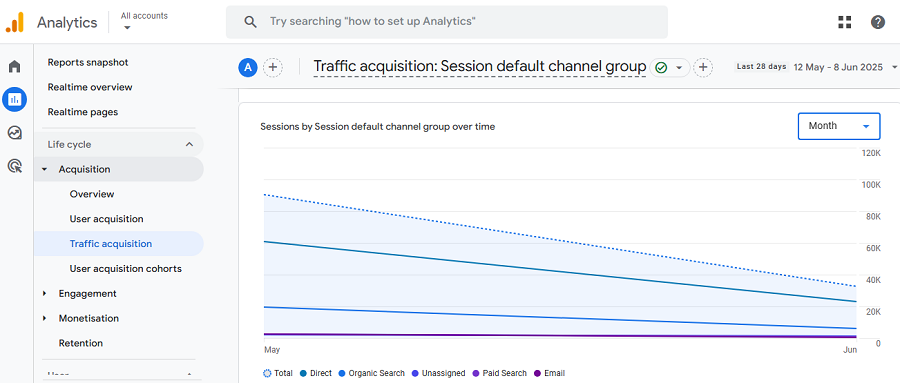
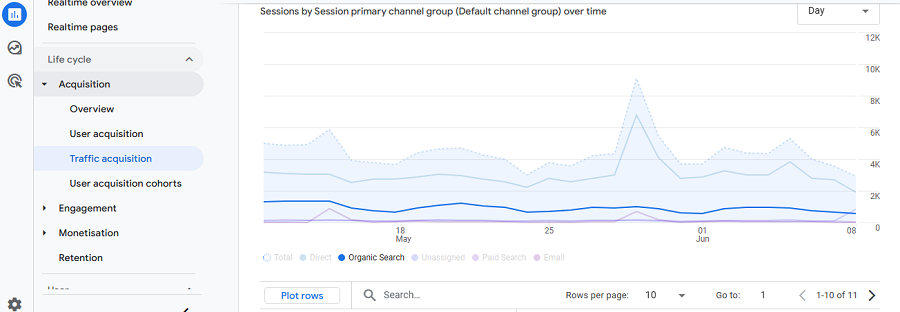
Apart from the number of users, how they find your website is also important. Traffic sources are another key metric that categorizes your traffic by different channels, like:
- Organic search: If your visitors search for a keyword on Google or other search engines and find your website, they’ll be regarded as organic traffic.
- Direct traffic: If someone types your website’s URL directly into their browser or visits it from a bookmark, web analytics tools categorize that as direct traffic.
- Referral: Backlinks from another website will be categorized as referrals.
- Paid: As the name suggests, paid traffic comes from ads.
- Social media: Users might see your website’s URL on platforms like Facebook or LinkedIn and come to your site. This is also an important traffic source for many websites.
- Email & SMS: If you run email and SMS marketing campaigns and include your website’s link in them, you can drive traffic to your site.
By analyzing your traffic sources, you can adjust your strategies to boost traffic from the most effective channels.
Here’s a general benchmark for traffic sources of a typical business website:
| Traffic Source | Typical Share |
|---|---|
| Organic Search | 40% – 60% |
| Direct Traffic | 15% – 25% |
| Referral | 5% – 15% |
| Social Media | 5% – 10% |
| Paid Ads | 5% – 20% (depends on your ad budget) |
| Email & SMS | 2% – 5% |
4. New vs. Returning Visitors
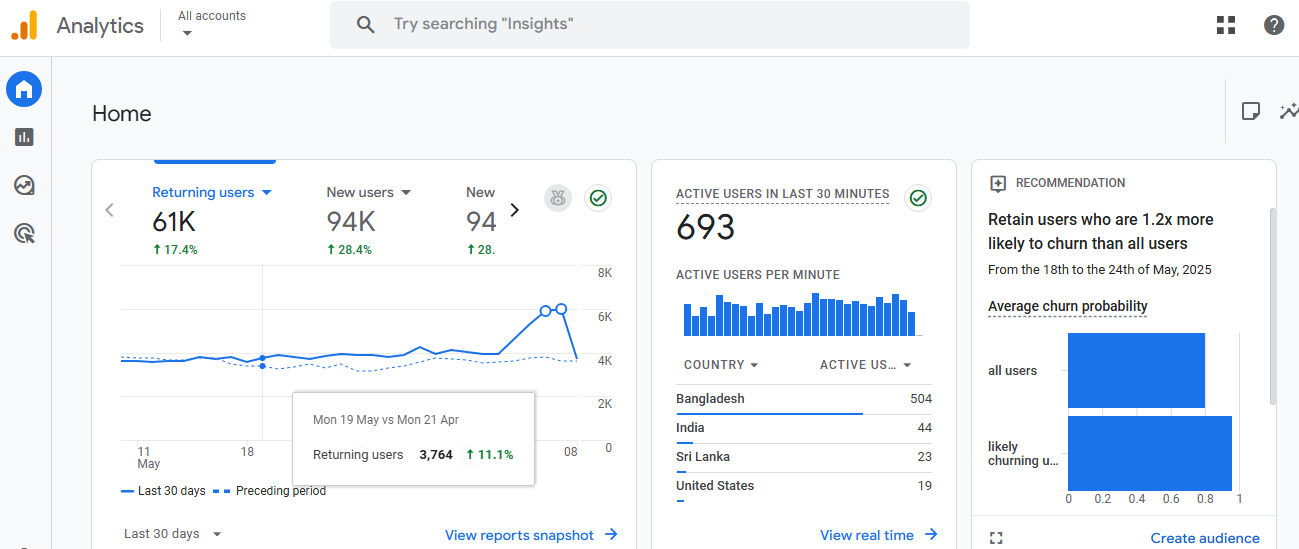
The last important traffic metric on our list compares the number of loyal visitors with the number of new visitors.
New visitors show that our website’s audience circle is growing. Meanwhile, returning visitors show loyalty. In fact, both are positive, but depending on your business age, you might need one of them more.
If you create a new website, you need to focus more on attracting new visitors to build awareness and spread the word. As your site grows, you have to focus on a higher percentage of returning users.
Engagement Metrics
After counting the number of visits to your website, you need to track the way they’re interacting with your content. Engagement metrics help you measure user interest, behavior, and how effectively your content encourages them.
Here are some of the most important engagement metrics in web analytics:
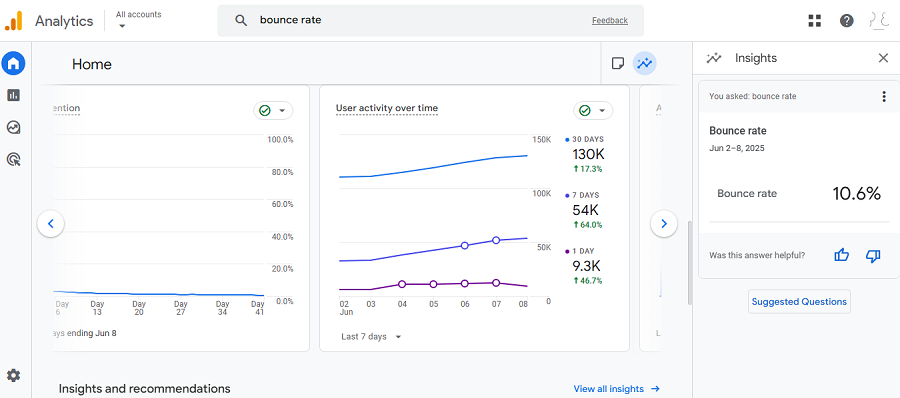
5. Bounce Rate
Bounce rate is the percentage of visitors who leave your website after viewing only one page. If visitors leave your site without clicking anything else and reading more content, your bounce rate will increase.
In other words, a bounce is a single visit without doing anything. A high bounce rate might have several meanings:
- It shows that the content didn’t meet user expectations
- Low bounce rates might be due to the load speed of your page
- It also might show that the design isn’t interesting and engaging.
Remember that the bounce rate alone isn’t always negative, and you have to interpret it considering the context.
For example, imagine a person searching for specific information on Google and finding your blog post. If they find the exact answer in the blog post, they will leave the page without doing anything else. This bounce is not due to the poor performance of your blog post, but because of the exact, fast answer.
Try to compare your bounce rate with similar websites using the following benchmarks:
- Blogs: 70% – 90%
- Landing Pages: 60% – 90%
- Content Sites: 40% – 60%
- E-commerce: 20% – 40%
- B2B Websites: 25% – 55%
If your bounce rate is above average, you must look at other metrics like page speed, content relevance, and user experience to find the reason.
There are some proven ways to improve bounce rate. For example, you can add internal links, optimize the layout, and include compelling CTAs to make your visitors engage more.
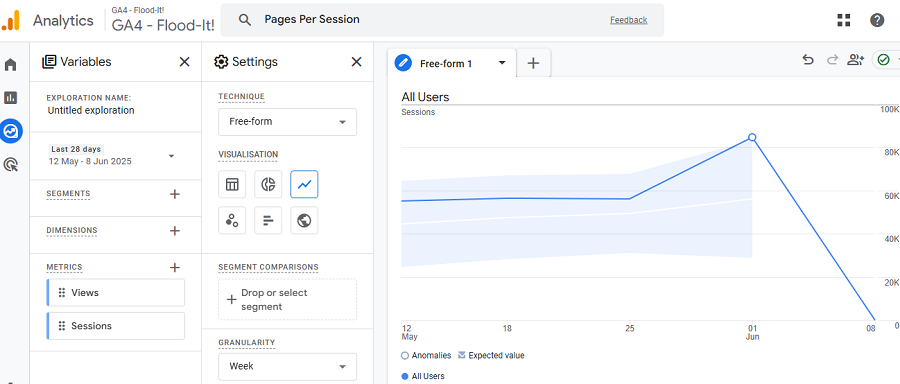
6. Pages Per Session
We talked about the total pageviews of your site, which was a traffic metric. However, the average number of pages a single visitor views during a single session is a measure of engagement.
A session is a certain period of time a user is active on your site. If the user becomes inactive for around 30 minutes, the session will be finished.
The higher the pages per session, the more engaged your users are. To increase this number, you must:
- Improve internal linking
- Create topic clusters
- Add compelling suggestions
For example, you can include “related posts” at the bottom of your blog post or add sidebar links to other popular posts.
Here’s a rough benchmark to evaluate your performance in terms of bounce rate:
| Pages per Session | Engagement Level |
|---|---|
| < 1.5 | Low |
| 1.5 – 3 | Moderate |
| 3 – 5 | Good |
| 5+ | Excellent |
It’s good to track your bounce rate across different traffic sources to see which channel is performing better.
7. Average Session Duration
Just like the number of pages, the time visitors stay on your website in a single session is also important.
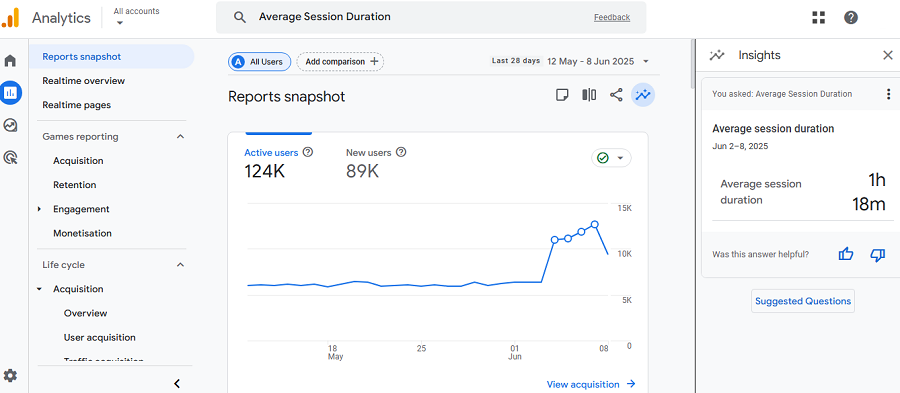
Average session time is another way to recognize how engaging your content is. The longer users stay, the better, because it shows they are reading your articles, viewing your products, or considering conversion.
Remember that session duration is an average of all visits, even the short ones and quick exits. So, visitors with low engagement can decrease this number.
Here is a good benchmark for average session duration in various sites:
- Blogs: 1 – 3 minutes
- E-commerce: 2 – 4 minutes
- News/Media: 3 – 5 minutes
- SaaS/Service Sites: 2 – 6 minutes
One way to improve session duration is by adding engaging media files like photos, videos, and infographics. Also, you can write longer-form content with engaging subheadings to encourage visitors to continue reading your content.
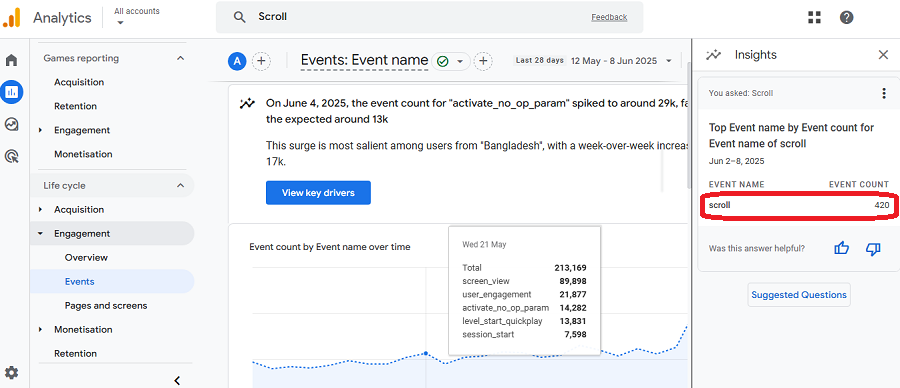
8. Scroll Depth
Web analytics tools can even collect data on visitors’ scrolling activities on your website. Scroll depth is a web analytics metric that measures how far down visitors scroll on your page.
Many tools allow you to track scroll behavior by percentage of total page length. For example, a scroll depth of 50% shows that the visitor has left your page before passing the halfway point.
Some of them, like GA4, on the other hand, only track 90% scroll by default, which means you can’t track 25%, 50%, or 75% scroll depths. Of course, there are some tricks to do that, like using Google Tag Manager.
Again, if you want to increase your scroll depth percentage, you can use engaging techniques like compelling hooks, optimized paragraphing, and clear prompts like “Keep reading to learn …”. In fact, in your article, you can create a sense of FOMO so that your visitors feel they might lose something important.
Conversion Metrics
Even if your visitors engage with your content, you might not reach your website’s goal, especially if you have an eCommerce business.
Conversion metrics show whether your website is actually reaching its main goals, like purchases, signups, or downloads.
Understanding them allows you to measure your success and optimize your strategies for better results and return on investment (ROI).
Here are the most important conversion metrics in web analytics:
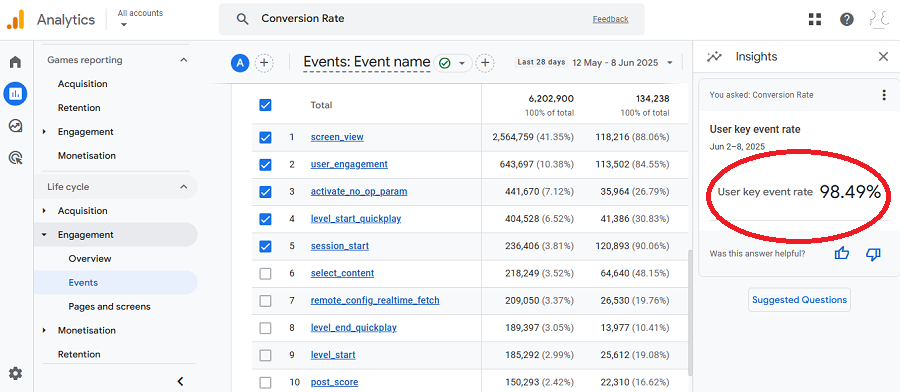
9. Conversion Rate
Conversion rate is the percentage of visitors who complete your desired goal on your website. For example, if a person fills out a form, buys a product, or subscribes to a newsletter, it counts as a conversion.
To calculate your conversion rate, you need to divide the number of conversions by the total number of visitors, and then multiply by 100. Here is an example:
- Number of people who visit your site: 100
- Number of people who make a purchase = 5
The conversion rate in this example will be 5%.
This metric is one of the most important indicators of your website’s performance. Even if you have high traffic but reach a low conversion rate, you must look for a problem on your site.
Many things like unclear messaging, poor design, or a complicated checkout process, might block users from taking action. Try to compare your conversion rate with general conversion rate benchmarks across industries:
| Industry | Average Conversion Rate |
|---|---|
| E-commerce | 2% – 4% |
| B2B Services | 2% – 5% |
| Lead Generation | 5% – 10% |
| SaaS Products | 3% – 7% |
A/B testing is a good idea to boost your conversion rate. You can try different versions for headlines, calls-to-action (CTAs), page layout, and load times to see which one appeals more to your audience.
10. Goal Completions
Goal completions track how many times users perform actions you’ve determined as your goals.
Most web analytics tools let you set up custom goals like:
- Contact form submissions
- Newsletter signups
- Trial account creations
- Product purchases
This metric helps you monitor how well users interact in your funnels and engage with your landing pages. If goal completions are low, you must revise your funnel steps. Try to optimize the number of forms and the number of steps, and make sure the process is not too complicated.
11. Revenue Per Visitor (RPV)
As the name suggests, Revenue per visitor tells you how much income you generate for every visitor. RPV is calculated by dividing total revenue by the total number of visitors during a specific period.
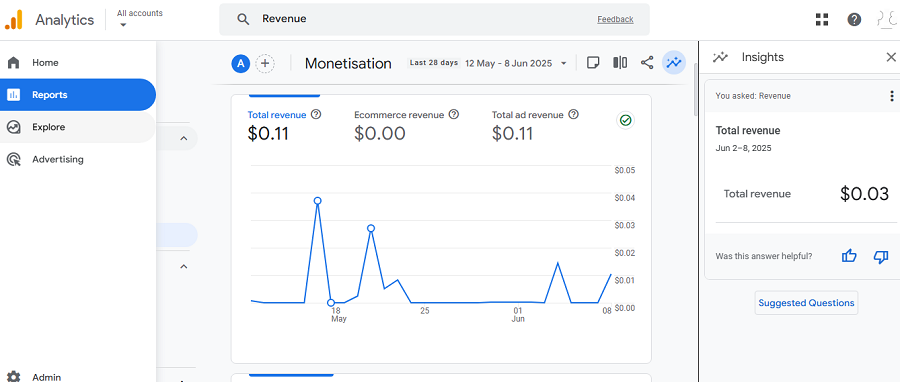
For example, if you make $1,000 from 500 visitors, your RPV is $2.00. This way, you can understand if your traffic leads to your business’s bottom line.
To improve RPV, you can follow the tips below:
- Increase average order value (AOV)
- Use cross-selling techniques
- Optimize product pages
- Simplify the checkout process
12. Customer Acquisition Cost (CAC)
To acquire a new customer, you need to invest in advertising, marketing tools, team salaries, and other related expenses.
CAC shows how much you spend to acquire each new customer. To calculate this web analytics metric, divide the total cost of your customer acquisition activities by the number of new customers gained.
Here is an example:
- You spend $1,000 on marketing
- You can acquire 50 new customers
So, your CAC is $20.
You must interpret your CAC along with other metrics like revenue per customer to see if your marketing is profitable.
13. Return on Ad Spend (ROAS)
ROAS measures how much revenue you earn for every dollar you spend on advertising.
It’s calculated as:
ROAS = Revenue from Ads / Cost of Ads
If you spend $500 on ads and generate $2,000 in revenue, your ROAS is 4.0. Some tools might represent it in percentage, which will be 400% for this example.
ROAS helps you understand how your ad campaigns work. To improve it, you need to work on ad targeting, irrelevant landing pages, or low conversion rates.
Here’s an average ROAS benchmark:
| Ad Platform | Average ROAS Benchmark |
|---|---|
| Google Ads | 2x – 4x |
| Facebook Ads | 1.5x – 3x |
| Instagram Ads | 1.3x – 2.5x |
Audience & Behavior Metrics
To run a serious business, you need a deep understanding of your audience and their behavior.
Audience and behavior metrics are key for personalizing experiences, improving navigation, and encouraging users to act.
Here are some of the most important metrics to analyze your audience’s behavior:
14. User Demographics
User demographics are about your visitors’ age, gender, and geographic location. Using this data, you can exactly know who’s interacting with your website. As a result, you can optimize your strategies and focus on that specific group that is highly engaged with your business.
For example, if you know your site’s users are mostly aged 18–24 and come from North America, you can make your content and design mobile-friendly, modern, and minimalist aesthetics.
Analytics tools provide various demographic data, including:
- Age groups (e.g., 18–24, 25–34, etc.)
- Gender (male/female)
- Location (country, city, region)
Demographics help you run targeted marketing campaigns and reach higher ROIs.
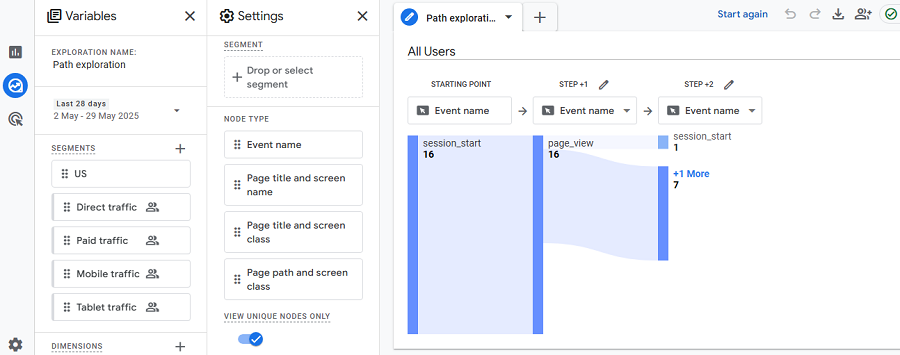
15. User Flow & Navigation Paths
User flow shows the path visitors take on your website, from the first page they come to your site to the actions they take before leaving.
This metric shows:
- Landing pages
- How they move between pages
- Where they leave (exit pages)
This helps you find problems in the flow. For example, you might discover that most users land on your blog post but leave before visiting your product page.
This way, you can optimize your content, internal links, CTAs, etc. You can track user flow using tools like Google Analytics or heatmaps on platforms like Hotjar.
Real-Time Metrics
Real-time metrics give you insight into what’s happening on your website right now. This helps you in faster decision-making, rapid issue detection, better campaign monitoring, etc.
Here are some key real-time metrics in web analytics:
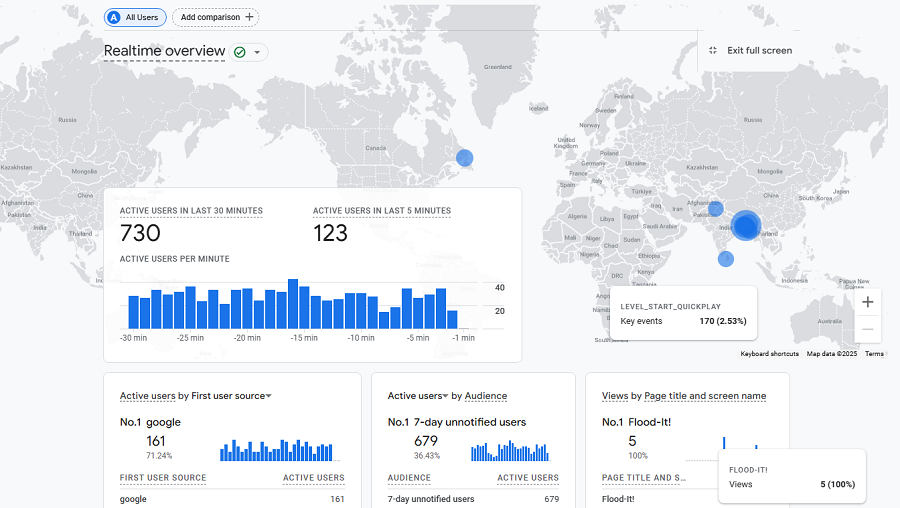
16. Active Users on Site
This metric tells you how many people are active on your website now. It’s critical data when you’re doing something time-sensitive, like a flash sale or a product launch.
For example, if you’re running a special offer and see lots of active users on your site, you can interpret it as a successful promo. If the number of active users is lower than your expectations, you need to optimize your ads on social media, email, and SMS campaigns.
Some tools, like Google Analytics, show you a live count of who’s on your site. You can also use tools like Hotjar to see heatmaps of where people are clicking or scrolling.
You can consider the following table as an average benchmark for your site’s active users:
| Website Size | Typical Active Users (Promo) | Peak Active Users (Major Events) |
|---|---|---|
| Small Website | 10–50 | Up to 100 |
| Mid-Sized E-Commerce | 100–500 | 500–1,000 |
| Large E-Commerce | 1,000–5,000 | 5,000–20,000+ |
| Enterprise | 20,000–100,000+ | 100,000–500,000+ |
17. Top Active Pages
This metric shows which pages active users are visiting the most right now. In fact, it tells you what’s hot on your site. Knowing this helps you detect what’s appealing to your audience so you can share it more on social media or in a newsletter to spread the word.
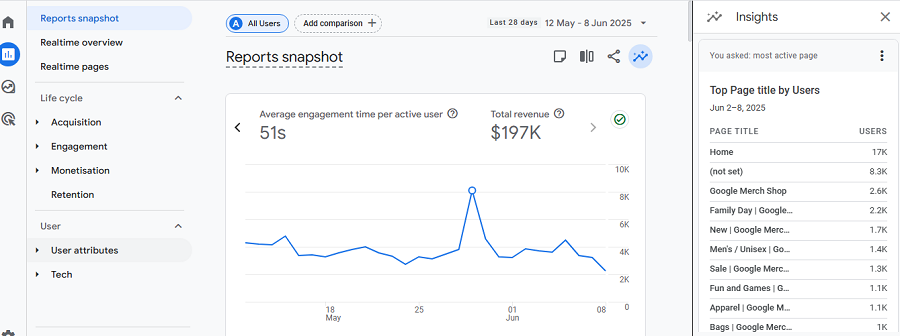
There’s no one-size-fits-all benchmark here. However, during a campaign, you might see 20–40% of your traffic on your newest or most promoted pages.
18. Live Traffic Sources
Finally, you have to check what sources are driving most of your live traffic to your website. Using this web analytics metric, you can find which marketing channel is working best and which channel is not working well. This is great for last-minute ads and events.
SEO & Content Metrics
SEO and content metrics show how well your website is doing in SERPs and how your content is performing for your target keywords.
Here are essential SEO metrics you must consider in your web analytics:
19. Organic Traffic
Organic traffic is actually the main purpose of SEO strategies. As we talked earlier, traffic sources are different. Now, we want to focus on organic traffic, which is really important for a website because it shows how well your SEO game is working.
Organic traffic is the number of people who find your site on search engines like Google or Bing. If you’re getting a lot of organic traffic, it means your content is ranking well for your target keywords.
You can track this using web analytics tools like GA4, WP Statistics, and Google Search Console, and also SEO-specific tools like Ahrefs.
For a small blog, you might see 500–5,000 organic visits a month. However, bigger sites can hit tens of thousands, depending on the industry.
20. Keyword Rankings
This metric tracks the position of your pages in search engine results for specific keywords. As you know, between 70-90% of all search traffic goes to the first page of results. So, it’s important to work on your SEO and try to improve this metric.
Tools like Google Search Console can show you your keyword rankings. You can use it to improve your content, change your backlink-building strategy, and improve your SEO performance.
21. Landing Page Performance
Landing page performance tells you which pages people first land on when they visit your site and how well those pages turn visitors into customers or leads. These are often your blog posts, product pages, or campaign pages, and they’re key to driving results.
Google Analytics can show you which pages get the most traffic and how many visitors act, like buying something or signing up. If a landing page is getting tons of visits but not converting, you might need to spruce up the design or add a clearer call-to-action.
For example, an e-commerce site might see 10–20% of traffic hitting top landing pages, with good ones converting at 2–5%. Use this data to make your key pages shine.
22. Click-Through Rate (CTR)
CTR measures how many times people click on your site’s link when it appears in search results. To calculate it, you have to divide the total number of clicks you get by the times your page appears.
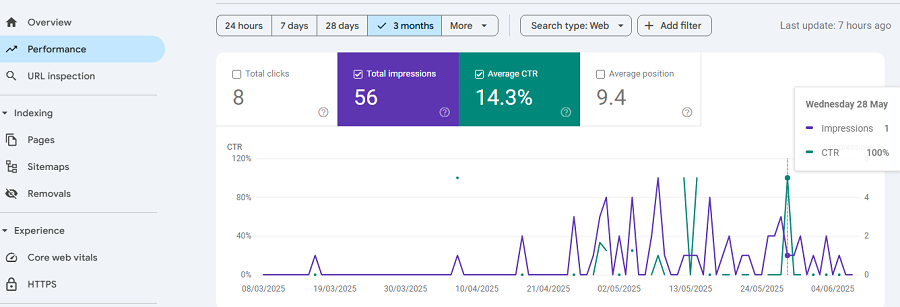
A high CTR means your page title and description are grabbing attention. You can check CTR using tools like Google Search Console. If it’s low, you need to rewrite your meta titles and descriptions to make them more catchy or relevant to what your audience is searching for.
The average CTR benchmark is dependent on the ranking of your pages and also the industry. For example, for pages that rank first on Google, you can expect a CTR of around 38-42% depending on your industry. For the next positions, the average CTR exponentially decreases. On average, you can expect a CTR of around 1.5% for position 10.
Website Health Metrics in Web Analytics
The last set of essential web analytics metrics we want to talk about is your site’s health. You must keep your website technically healthy, just like you work on your content.
Here is a summary of what you need to focus on to have a healthy website:
- Speed: A fast site is equal to better SEO and user experience
- Mobile-first: This is a must in 2025
- Exit rates: This helps you detect weak pages on your website
Here are more details about health metrics:
23. Site Speed & Load Time
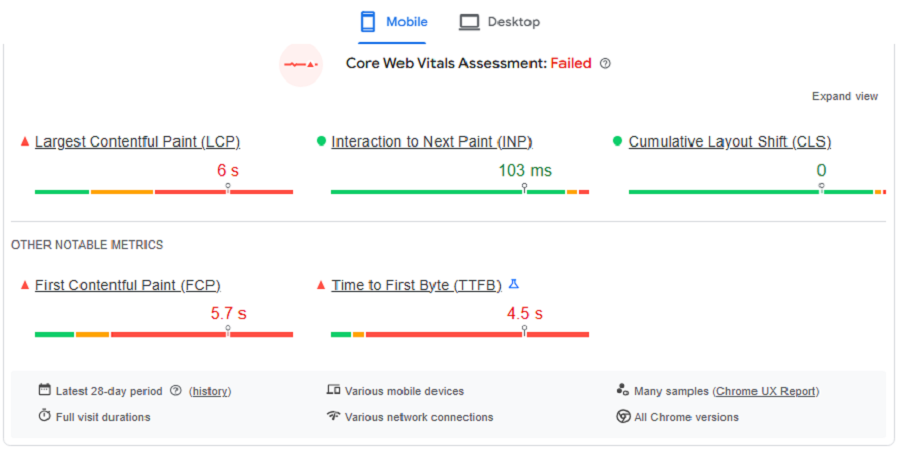
This metric measures how quickly your pages load for visitors. A fast site keeps both Google and your visitors happy.
Many tools offer pagespeed tips like compressing images, switching to faster hosting, and enabling lazy loading. On average, you can consider the following benchmarks:
- Target Load Time: Under 2–3 seconds
- E-commerce Goal: Under 2 seconds
24. Mobile vs. Desktop Traffic
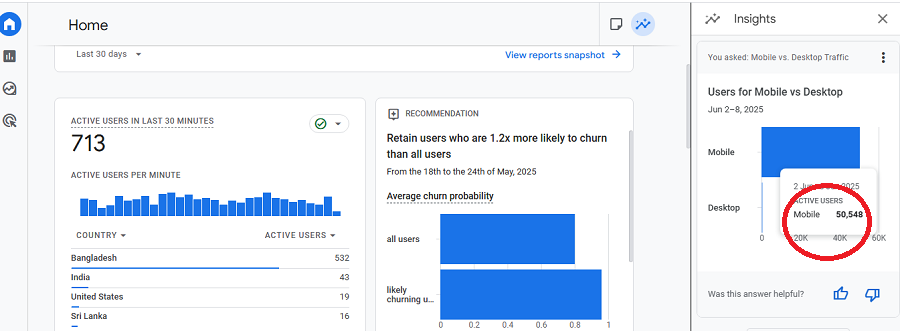
Mobile is now sending 60-80% of all traffic to websites. So, you need to focus on this health metric on your website.
Web analytics tools allow you to find mobile usability issues and compare your website’s performance on desktop vs mobile.
25. Exit Rate
The exit rate shows where people are leaving your site. This metric looks at the last page a user sees on your website.
When the exit rate of a page is high, there is something wrong with that page. You can consider an exit rate of below 40–50% as a benchmark for your important pages.
Best Tools for Analyzing Web Metrics
Now that you know the most important web analytics metrics, you need to choose a versatile tool to measure them.
The following table compares the best web analytics tools to help you select the right tool for your business:
| Tool | Best For | Key Features | Pros | Cons |
|---|---|---|---|---|
| WP Statistics | WordPress sites & privacy | On-site data, no external sharing | Simple, data stays on your server | Advanced features are paid |
| Google Analytics | General website tracking | Real-time data, conversion tracking, SEO data | Free, robust, widely supported | Complex setup, privacy concerns |
| Matomo | Privacy-focused tracking | Self-hosting, GDPR compliance, customizable | Full data control, open-source | Requires technical setup |
| Adobe Analytics | Enterprise-level insights | Predictive analytics, advanced segmentation | Scalable, rich features | Expensive, steep learning curve |
| Hotjar | User behavior visualization | Heatmaps, session recordings, feedback polls | Visual, intuitive | Not detailed on traffic sources |
| Mixpanel | Product and event tracking | Funnel analysis, cohort tracking, A/B testing | Deep behavioral insights | More complex for content sites |
| Google Search Console | SEO and website performance | Keyword data, indexing status, search appearance | Free, essential for SEO, integrates with GA4 | Limited behavioral data, not for full analytics |
Of course, web analytics tools like Google Analytics and Google Search Console are the priority for all websites.
However, you must go for other tools if you need more detailed reports and simplicity. For example, if you use WP Statistics, you can track these web analytics metrics directly from your WordPress website.
Conclusion
Web analytics metrics help you measure the performance of your site and find its weaknesses and strengths.
Here, we listed the 25 most essential web analytics metrics to help you focus on the most important data to get the best result.
Of course, you need to use the right tool to get the best result. You might have to use several tools to cover all the essential metrics.
GA4, Google Search Console, and WP Statistics are the best set of web analytics tools you can use for websites of all sizes and types.
If you need help on your web analytics journey, you can always contact us.
FAQs
What are web analytics metrics?
Web analytics metrics are data collected from your website’s visitors to understand how users interact with your site.
What is a good bounce rate?
A bounce rate under 40% is generally good, but it varies by industry and content type.
How often should I check my web analytics?
It’s good to check core metrics weekly and also do a deep dive each month.
What tools are best for beginners?
Google Analytics, Google Search Console, and WP Statistics are the best tools for analyzing your website’s performance.