Many online shops spend a lot of time and money to boost their WooCommerce store sales, but they fail.
One of the most serious mistakes they make is that they don’t know what their customers want and how they can engage with them.
Thanks to analytics tools, you can easily track your WooCommerce store’s customers’ behavior. This helps you understand what appeals more to them and what they don’t like.
Apart from traditional tools like Google Analytics, you can use WordPress plugins like WP Statistics to analyze your users’ behavior without leaving your site.
Here, we’ll explain how you can use this tool to perform behavioral analysis on your WooCommerce site and improve its performance.
Why Track User Behavior on Your WooCommerce Store
Sales numbers only tell you what happened in your online shop. However, it doesn’t give you any insight into why it happened.
To improve your strategy and increase your sales, you need behavioral analytics to understand what your visitors like and what they don’t like.
In fact, by tracking user behavior, you can see your WooCommerce store just like your customers see it.
Here are some advantages of WooCommerce customer behavior:
- Improving conversion rates at the same traffic
- Identifying friction points in the checkout process
- Reducing cart abandonment.
- Optimizing product pages based on real engagement
- Improving UX decisions by data
In fact, customer behavior analytics helps you understand exactly where users lose interest in the buying journey.
So, you can have a closer look at what happens during the following process:
- Landing page or product discovery
- Product page view
- Add to cart
- Checkout
- Purchase (or abandonment)
By analyzing the behavior of your visitors in this process, you can find where users drop off.
For example, if you have high product page views but low add-to-cart rates, there might be a problem with pricing, trust, or product copy issues. As a result, you can optimize your business plan based on a data-driven approach.
Why Choose WP Statistics for Customer Behavior Tracking
WP Statistics is one of the best web analytics tools to track the behavior of your WooCommerce customers.
It’s a self-hosted WordPress plugin that collects visitor data with a focus on user privacy and GDPR compliance.
Unlike traditional analytics tools, it doesn’t use cookies unless you intentionally enable cookies.
It gives you visibility into how customers interact with your WooCommerce store, without sharing data with third-party platforms and using Personally Identifiable Information (PII).
Here are the key advantages of using WP Statistics compared to other tools:
- Privacy-First and GDPR-Friendly: WP Statistics is GDPR-compliant by default and doesn’t track users across websites or monetize their information.
- WordPress Integration: WP Statistics is specifically designed for WordPress websites. You just need to add the plugin to your website to track users’ behavior on your dashboard.
- Lightweight and Transparent: WP Statistics is really simple to use and focuses on important metrics without making your dashboard crowded with unnecessary data.
Take a look at the following table to compare it with other alternatives:
| Feature | WP Statistics | Google Analytics |
|---|---|---|
| Data ownership | Fully self-hosted | Stored externally |
| GDPR complexity | Low | High |
| Cookie dependency | Minimal | High |
| WordPress integration | Native | External |
| Setup complexity | Simple | Moderate to complex |
| Real-time visibility | Yes | Limited |
Steps to Analyze WooCommerce Website Customer Behavior
Here is a step-by-step guide to track WooCommerce customer behavior:
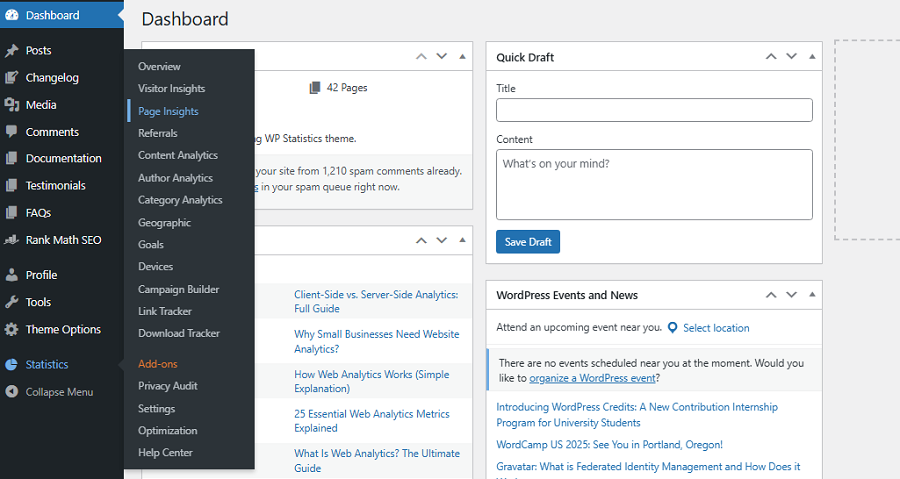
Step 1: Install and Configure WP Statistics
First, you need to install the plugin and configure it based on your requirements. The installation process is really straightforward:
- Go to your WordPress dashboard
- Click Plugins in the left-side menu
- Tap Add Plugin
- Type “WP Statistics” in the search bar and find the plugin
- Click Install
- Tap Activate
Now, you can see the Statistics menu on your WordPress dashboard. After installation, you can customize many items, like your time zone and site domain. Also, you can determine whether to track logged-in users or exclude bots.
It’s possible to exclude your own ID from tracking so that you get more exact results about your website visitors.
Finally, it allows you to enable/disable IP anonymization. Remember that this option will impact privacy settings and GDPR compliance.
Step 2: Take a Look at the Overview
WP Statistics gives you a summary of what happened on your site in different timeframes, like daily, weekly, or monthly.
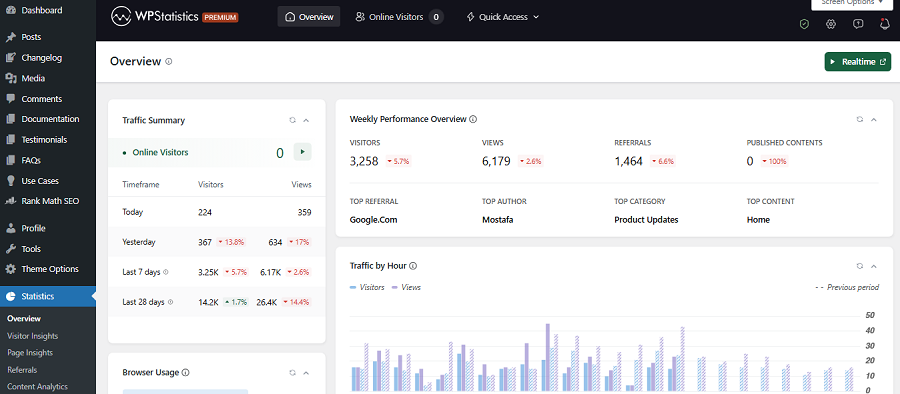
Go to Statistics and check this report to have an understanding of your site’s performance. Focus on views and visitors. This gives you an insight into how many people visit your shop and how many times they come to your website.
If you see a sharp rise or decline, you have to find the reason and try to make the required changes to your website or your campaigns.
For example, if you have recently run a flash sale campaign and received a high traffic volume, it shows your users have liked that campaign.
Step 3: Track Product Page Views
Apart from the overall traffic of your site, you need to know how many page views each of your products has received.
It shows which products attract attention and demand, and helps you focus more on those products in your future campaigns. You can access this feature through the Data Plus add-on of WP Statistics.
Step 4: Check Exit Rates
It’s really critical to know what pages make your visitors leave your site. Although it doesn’t necessarily mean your visitors hate that page, analyzing exit rates on your site helps you understand the behavior of your customers.
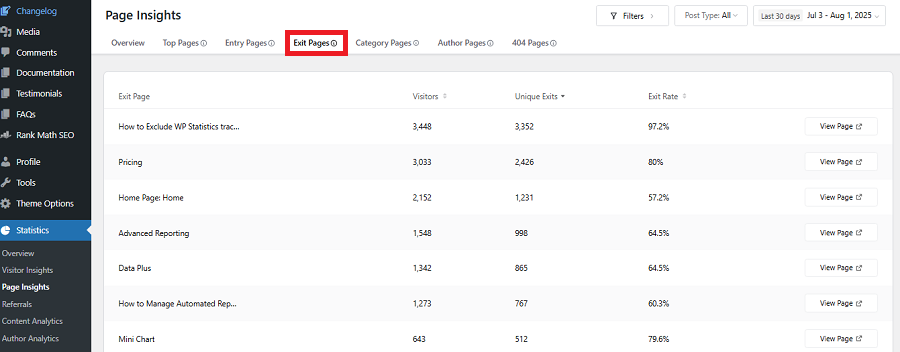
Try to check the exit rate of your product page to find the products that can’t encourage people to complete the buying journey. You can then track the checkout page exit rate to find problems like:
- Friction
- Trust issues
- Unexpected costs
Finally, take a look at exit pages to highlight where customers drop off before buying something from you. To analyze exit rates, you just need to go to Page Insights under Statistics.
Step 5: Find Top Entry Pages
If you can identify where your WooCommerce visitors start their journey, you can guess their interests and optimize your strategies accordingly.
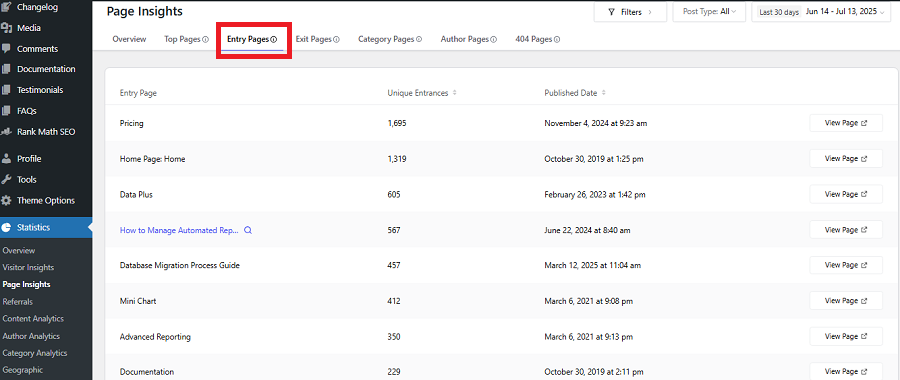
WP Statistics helps you check the top entry pages where your visitors land on your site. Then, compare it to the exit pages to find the most and least interesting pages on your WooCommerce store.
Step 6: Measure Buying Intent
It’s important to analyze the behavior of customers in their shopping carts. Cart abandonment is one of the most important concerns of WooCommerce stores. Cart page visits help you measure buying intent and progression and find any friction in this path.
Step 7: List Top Queries
WP Statistics gives you a useful insight into what your visitors have searched on search engines like Google to find your website.
If you know the top keywords your site ranks for, you can optimize your SEO and content strategy and drive more traffic to your pages.
If you want to access this data, you have to use the Marketing Add-on on WP Statistics.
Step 8: Monitor Internal Search Terms
Apart from keywords visitors search on Google, you need to know what they are looking for on your site.
Your search bar is really impactful because many users search for products using this feature.
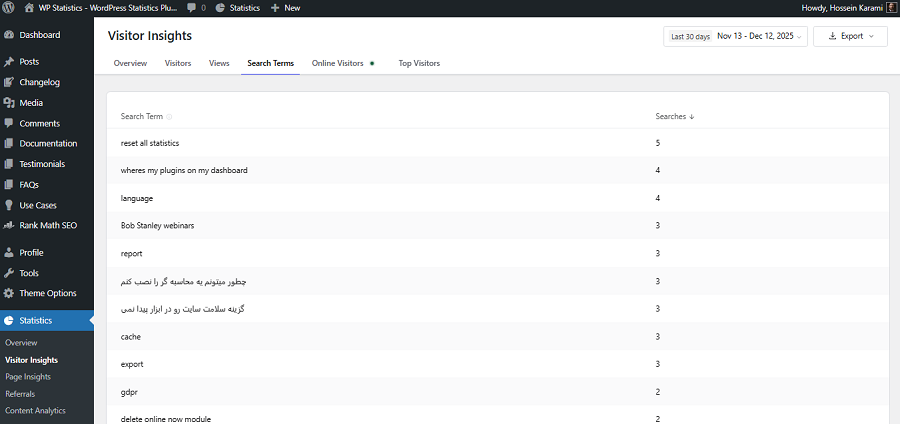
WP Statistics has a great Search Terms feature that lets you track top keywords people have searched for on your site. So, you can understand what products they like most.
Step 9: Track Link Clicks & Downloads
A great behavioral analysis is to see what links your users have clicked and what they have downloaded from your site.
WP Statistics offers a great feature to track links and downloads to help you understand your users’ behavior. This is available through the Data Plus add-on.
Step 10: Device-Based Behavior:
A useful report about your users’ behavior is to segment their devices into mobile and desktop. This helps you find UX issues that damage conversions on specific devices.
How to Use Behavioral Analytics to Improve Your Business
Now that you know what metrics you should track and how to use WP Statistics to do that, it’s good to interpret the results.
The following table summarizes the way you have to use the behavioral analytics results to optimize your website:
| Behavior Insight | Optimization Action | Expected Outcome |
| Many views, few add to cart | Clear value, better button | More items in cart |
| Visitors leave product pages fast | Better images, simple benefits | Longer visits |
| Users leave checkout | Fewer fields, guest checkout | Fewer lost orders |
| Cart page visited, no checkout | Show shipping cost early | More checkouts |
| Mobile users leave checkout | Fix mobile layout | More mobile sales |
| Traffic doesn’t buy | Improve targeting | Better visitors |
| Users leave category pages | Better filters, layout | Easier browsing |
| Repeat visits, no purchase | Reviews, trust badges | More sales |
Remember that these recommendations can vary based on your niche and your audience. However, the overall procedure doesn’t change.
You can consider the following tips when analyzing your customers’ behavior on your WooCommerce store:
1. Identify “False Interest” Products
If a product gets many views but has a very short time-on-page, it means your users are curious, but unconvinced.
It’s good to rewrite the opening section of the product page and try to immediately answer why this product exists and who needs it.
2. Shorten the Decision Moment
You have to find the pages where users pause but don’t click. Add one clear primary CTA above the button and remove other buttons because they might slow down decision-making.
3. Fix Dead-End Pages
Use behavior signals to find exit pages. Then, add contextual links, like related products, FAQs, or guides, to keep them engaged.
4. Reduce Complexity on Category Pages
If your users scroll but don’t click products, your category page might make them think too much. To solve it, try to reduce filters, highlight top products, and limit visible options to guide choice.
5. Improve Micro-UX on Checkout Pages
If you have high exits during checkout, you must have small frustrations. You can use small changes to improve UX, like:
- Inline error messages: Show mistakes immediately next to the field, so users know exactly what to fix.
- Autofill fields: Automatically fill in details like name or address to save time and effort.
- Progress indicators: Show steps like “Shipping → Payment → Review” so users know the process.
6. Match Page Content to User Intent
Try to compare behavior from different sources and edit your content accordingly. For example, if the page’s traffic is more from paid or social sources, you need to match the content based on the ad you’ve put on social pages.
Conclusion
WooCommerce stores are on the rise, but many owners, especially small shops, face disappointing results.
One key reason can be a lack of enough information about customers’ interests. When you don’t know what they like, you can’t optimize your WooCommerce website’s strategy.
WP Statistics helps you track key metrics that show your customers’ behavior to identify problems and strengthen high-performing parts.
So, don’t wait. Install WP Statistics for free and get started with your analytics journey.
FAQs
What is customer behavior analytics?
Customer behavior analytics is the process of identifying customers’ interactions on a WooCommerce store, like browsing, cart abandonment, repeat purchase, etc.
What’s the best tool to track a WooCommerce store’s performance?
WP Statistics is one of the best WordPress web analytics plugins that can track the most important metrics for analyzing a WooCommerce shop.
What metrics should I track to analyze my WooCommerce customer behavior?
You can track metrics like product page views, time on page, add-to-cart rate, cart exit rate, and checkout exit rate.