Heatmaps and scrollmaps are both useful analytics methods that show hidden user behaviors. They can greatly help you understand the weaknesses and strengths of your website’s design and content.
Of course, interpreting them needs a bit of expertise. In this blog post, we’ll explain what heatmaps and scrollmaps are and how you can use them to improve your website.
Also, you’ll learn the key differences between heatmaps and scrollmaps to use them correctly in your website auditing strategy.
What Are Heatmaps in Web Analytics?
A heatmap is basically a colorful display of the activities of your website’s visitors. It shows where people are active on your website.
Web analytics tools usually use colors like red and orange to spot parts of your website where users click or hang out. Also, they use different colors, like blue or empty areas, for areas that are ignored by visitors.
So, heatmaps turn your visitors’ activities into a map that everyone can interpret, even beginners.
As a result, you don’t need to struggle with numbers to calculate the engagement of users. Heatmaps show the truth to help you see:
| Type | Goal | Benefit |
|---|---|---|
| Click | Where people click or tap | Checking buttons, menus, and links |
| Hover | Where the cursor just sits | Seeing what catches the eye |
| Move | The actual path the mouse takes | How people “read” the page |
| Engagement | How long do people stay on each part | Figuring out interesting items |
In fact, heatmaps track the interactions of users on your page via their mouse activities. Here is what heatmaps show:
Find fake buttons
Sometimes people click on items, like images, icons, or text, that aren’t linked. In fact, they expect to find more information about those items.
In traditional web analytics, you can’t find these behaviors, but heatmaps will give you detailed insights into these fake buttons.
You can use this report to revise your content and make more clickable items to increase the engagement rate.
Spot less-attractive items
This especially happens on product pages. Visitors usually watch pretty photos while important items like the specs tab or “key features” section get no notice.
Using heatmaps, you can easily spot those items and improve them to attract the attention of visitors.
Improving layouts
Heatmaps make the process of designing landing pages much easier. They help you find friction and dead zones on important sections. You can use them to optimize the design and improve user experience.
What Are Scrollmaps in Web Analytics?
Scrollmaps measure how much users scroll on a page. Then, web analytics tools translate that data into a visual gradient to show you where users’ journey on your page ends.
As you know, traditional web analytics gives you the number of visitors and total views of a page.
However, it can’t see how much of the content the visitors have read. That’s where scrollmaps can be beneficial.
A scrollmap shows how far people read into your blog posts and uncovers which parts of your page are attractive to your visitors.
Scrolling behavior usually shows interest and momentum, and scrollmaps display it in a visualized form to make behavior analytics much easier for you.
Scrollmaps help you analyze long-form content, landing pages, and multi-section layouts.
Using scrollmaps, you can figure out:
- If visitors scroll down the hero section.
- Whether or not they see the main CTA.
- If your content flows naturally from section to section.
- If your page is too long, too dense, or too overwhelming for mobile users.
Overall, scrollmaps often reveal recurring patterns like:
| Pattern | Output | Solution |
| Early drop-off | Weak intro | Strengthen the top section |
| Steady fade | Good flow | Maintain structure |
| Mid-page dip | Friction point | Edit or simplify the area |
| High depth + low action | Missed CTA | Reposition or clarify CTA |
If you use scrollmaps in the right way, they can be an analytics tool for auditing your website. They show you:
- Design issues
- User journey problems
- Content weaknesses
Heatmaps vs. Scrollmaps: Key Differences
Although both heatmaps and scrollmaps are in the same category of behavioral analytics tools, they provide different insights. If you want to interpret them correctly, you have to know these differences.
As said earlier, heatmaps track interaction, while scrollmaps show content visibility. In other words, heatmaps focus on what users click and hover over on your page, and scrollmaps reveal how far down a page they visit.
A heatmap might show low engagement with a CTA and help your team recognize that the button doesn’t attract attention.
On the other hand, a scrollmap might say that most visitors don’t reach the section of the page where you’ve put the CTA. This might be more basic than the details of a heatmap. However, without this information, you can’t make the right decision.
Also, sometimes the result of a scrollmap might be misleading. For example, if scrollmaps show that users scroll the entire page, you might think that the page is perfect. But a heatmap can show that visitors don’t interact with the elements in their visits. This tells that the content is interesting, but it doesn’t encourage visitors to take action.
In fact, without analyzing both analytics, you can’t find the right solution because you don’t know the true reason.
The following table summarizes the key differences between heatmaps vs scrollmaps:
| Category | Heatmaps | Scrollmaps |
| Focus | Interactions | Scroll depth |
| Data Type | Clicks, hovers, movement | Visibility, reach |
| View | Element-level | Page-level |
| Shows | Intent, attention | Drop-off, engagement |
| Best For | UX, CTAs, navigation | Content flow, layout |
| Strength | Granular detail | Broad overview |
| Limitation | No page-depth context | No interaction context |
The Best Web Analytics Tools for Heatmaps and Scrollmaps
Behavioral analytics has grown rapidly, and modern tools now offer sophisticated heatmap and scrollmap capabilities with minimal impact on performance.
While different products suit different needs, several platforms consistently stand out for their accuracy, ease of use, and actionable insights.
Some tools are designed for deep UX research, while others specialize in marketing optimization. Many combine heatmaps and scrollmaps with session replays, form analytics, funnels, and A/B testing. This blend allows teams to view user behavior from multiple angles.
Here is a concise overview of the leading tools:
| Tool | Key Features | Best For |
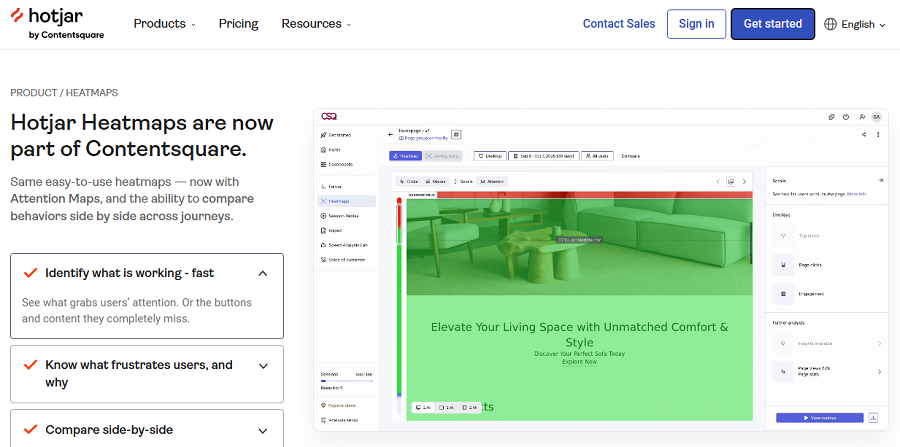
| Hotjar | Clicks, scrolls, recordings | Small to mid websites, UX insights |
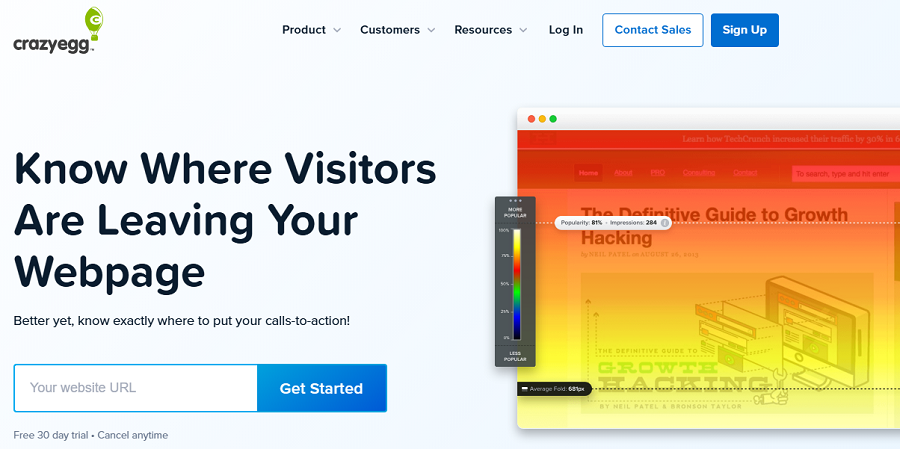
| Crazy Egg | Click, scroll, A/B testing | Conversion optimization |
| Mouseflow | Session replay, funnels | UX testing, behavior analysis |
| FullStory | Visual analytics, journey mapping | Enterprise-level UX insights |
| Lucky Orange | Live sessions, chat | Small to medium sites, engagement tracking |
| Inspectlet | Clicks, scrolls, form analytics | Behavior analysis, CRO |
Some platforms excel in speed and simplicity, while others offer enterprise-level precision. The “best” tool ultimately depends on your traffic volume, optimization goals, and how deeply you want to analyze behavioral data.
Tips for Interpreting Heatmaps and Scrollmaps
Now that you know what heatmaps and scrollmaps are, learn how to use them to improve your website.
Here are the best practices when analyzing heatmaps and scrollmaps on your website:
- Qualify the results: The colors are obvious, but you still need to know more to be able to analyze. Try to understand who’s visiting, what phone or computer they’re on, and why they came.
- Use heatmap & scrollmap at the same time: Heatmaps show if people click items, and scrollmaps show if they saw the items. If you don’t consider them together, you can’t find the problem to fix it.
- Check mobile and desktop visitors separately: Visitors who use mobile phones scroll way more than desktop users. Also, they tap anything that looks like a button. In fact, an item that looks dead on a computer screen can be interesting on mobile. So, you have to analyze them separately.
- Consider traffic source: Filter the results by traffic source to have a better picture of heatmaps and scrollmaps. A visitor who clicked your link in an email is totally different from someone who googled something and found your page. So, you have to analyze them differently.
- Consider a longer period: Sometimes, one viral post can change the result. So, you should not consider it for decision-making. You have to wait a few weeks to have a general view of your visitors’ behavior.
- Optimize clickable items: When your visitors click something that doesn’t work, you have to create a clickable item linking to more information or something they want.
Conclusion
Heatmaps and scrollmaps can show you behind the scenes. Using heatmaps, you can see where your visitors have clicked or waited. Also, scrollmaps show how much of the page has been read by your visitors. Remember that you can’t audit your site based on this data without considering other analytics results. Try to track all important behavioral metrics to spot issues and optimize your website’s layout and content.
FAQs
What are heatmaps best for?
They show exactly where people click, tap, or hover on your page. So, they are perfect for spotting what your audience is interested in and what they hate.
What is a scroll map?
It’s just a map that shows how far down your page visitors scroll. Web analytics tools usually use red/hot colors to show that lots of people scroll an area on a page. Also, they use blue/cold colors to display parts of a page that visitors ignore.
What’s the difference between scrollmap and heatmap?
A scrollmap answers the question of “Did they even see it?”, while a heatmap answers the question of “Did they click or care about it?”. In fact, scrollmaps are about visibility, and heatmaps are about interaction.
When not to use a heatmap?
When you have very low traffic and visitors, your database is small, and heatmaps can not be trusted.
Can heatmaps be misleading?
Yes! People might leave their mouse on something while they are not at their computers. So, you can’t decide solely based on the heatmaps’ result. You have to double-check the data with other analytics reports.