Location-based analytics is essential for businesses of all sizes and types. Whether you have a small business or a multinational company, you need to analyze your site’s performance with regional segmentation.
In addition to tracking customer behavior in each region, location-based analytics can help you improve your page load times.
In this blog post, we’ll explain the importance of location-based analytics and its impact on load time.
What Is Location-Based Analytics?
Location-based analytics is about tracking your site’s performance based on the location of your users.
In fact, you have to segment your audience based on their location to understand how differently your site’s performance is in different regions.
You can analyze different metrics considering this segmentation, including the load time of your pages.
Along with analyzing your site’s speed, you have to see how fast your pages load with specific regional details, like:
- Country
- Region or state
- City
- ISP or network
- Connection type (4G, 5G, broadband, fiber)
How Location Influences Page Load Time?
You might ask why you have to track load time based on location, while people around the world are connecting to your site using high-speed internet connections.
Here is the impact of location on page load time:
1. Physical Distance
Although data travels fast, your users don’t receive it instantly. Imagine that your website is stored on a server that is thousands of miles away. So, the time increases, and if the content isn’t cached close to the user, the delay will be significant.
For example, a user in South Africa who wants to access data from a server in Virginia faces milliseconds delays compared to someone in New York.
It should be noted that a CDN can minimize the difference. A Content Delivery Network is a network of servers that are distributed in different locations to deliver web content to users based on their location.
This system will cache content, like images, videos, and files, on servers closer to your users. This offers a better user experience.
2. Network Quality Varies in Different Regions
Some regions have modern infrastructure, so your pages will load almost instantly. However, many countries rely on older technologies with cellular networks, crowded ISPs, and unreliable routing. As a result, your pages might load with delays in these regions.
3. Regional & ISP Issues
Imagine that you have a great global setup, but a single ISP in Brazil shows latency spikes. Location-based analytics helps you recognize this spike and other load issues in different regions.
4. Local Devices & Browser Preferences
Different countries use different devices, and this impacts the load time. In poor areas, many people use low-end devices, while in developed regions, people use modern devices and browsers. This impacts how fast your pages load in these regions. Using regional analytics, you can recognize the differences.
5. CDN Coverage
Remember that CDNs don’t offer equal coverage in all parts of the world. For example, if a CDN doesn’t have a local PoP (Point of Presence) in a region, your content will load more slowly because users have to connect to a faraway server.
Key Metrics for Location-Based Performance Analysis
Now, let’s see how you have to track your site performance based on your visitors’ location. Here are the performance metrics of your site that you have to analyze by location segmentation:
1. Time to First Byte (TTFB)
This is a direct indicator of issues you might face regarding server or CDN proximity. A high TTFB in one region means that caching is not enough or that servers are far away.
Also, if you see a high TTFB in some regions for a long time, you have to think of server performance issues.
2. First Contentful Paint (FCP)
This is one of the most important metrics that shows the speed of your site. It measures how fast your site’s visitors see initial page elements. Remember that this metric usually depends on the users’ devices and network speed.
3. Largest Contentful Paint (LCP)
Another important Web Vitals is LCP, which is an important metric to measure the loading speed that your visitors feel.
It’s the time it takes for your main content, including images, videos, and texts, to load. It’s a user-centric speed metric and can greatly impact user experience.
Slowdowns in LCP usually indicate:
- Large hero images that are not properly optimized.
- CDN cache is missing, which makes your content load with a delay.
- There is a heavy JavaScript blocking the rendering process, which slows down the page and stops it from showing content quickly.
4. DNS and TLS Resolution Time
DNS and TLS resolution time is how long it takes for a browser to look up your website’s address and create a secure connection.
DNS and TLS times might be different in various regions. The reason is the distance and routing quality to the DNS resolver and to your server/CDN’s TLS termination point.
5. Fully Loaded Time (FLT)
Fully Loaded Time is how long it takes for everything on your page to load completely. In fact, all items should be fully loaded, including items that other companies have added.
So, the visitor can see everything, like:
- Ads
- Social media buttons
- Tracking tools
- Analytics.
Remember that some of these external tools can load much more slowly in certain countries. This makes the whole page load slower in those countries.
Best Tools for Tracking Location-Based Performance
Here are the best web analytics tools that offer speed performance insights and help you improve your page’s load time:
1. Google PageSpeed Insights
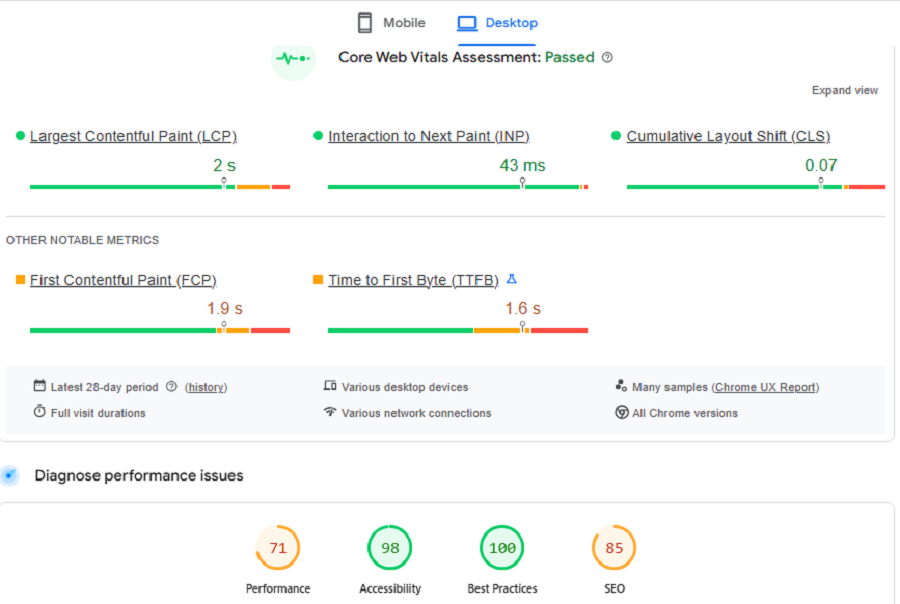
Google PageSpeed Insights (PSI) is a free tool from Google that analyzes webpage performance on mobile and desktop.
It’s great for quick audits of load times and Core Web Vitals, like LCP, FCP, CLS, and INP. More importantly, it offers actionable tips to help you fix your website to have better speed performance. This is great for beginners and small business owners who don’t have a professional developer and SEO team.
For example, it gives tips for optimizing images or reducing third-party script delays, with impact scores.
It can also divide the results based on the device to understand the performance of your website on different devices.
2. SpeedCurve
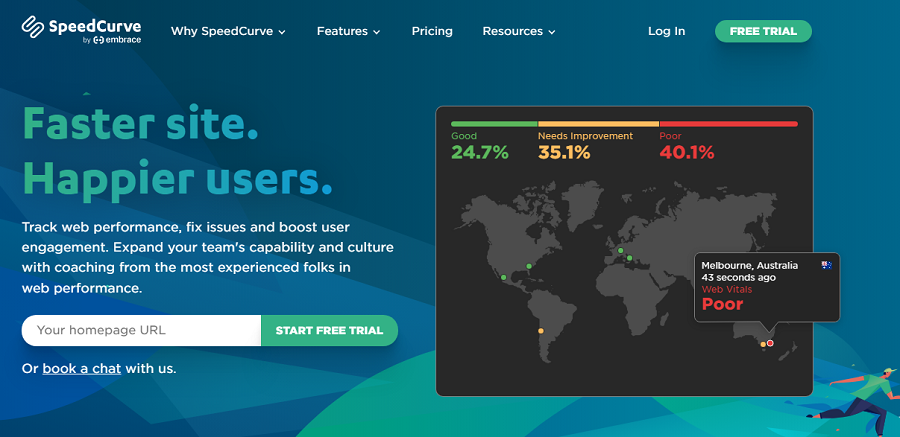
SpeedCurve is a web performance tool that blends real user monitoring (RUM) and synthetic testing. It offers a user-friendly dashboard to track Core Web Vitals, like LCP, FCP, CLS, and INP, along with load times.
If you want to link speed data to real business results, it’s a perfect choice for you. It helps you improve conversion rates and user experience using visual timelines, filmstrips, and side-by-side comparisons.
3. Datadog RUM
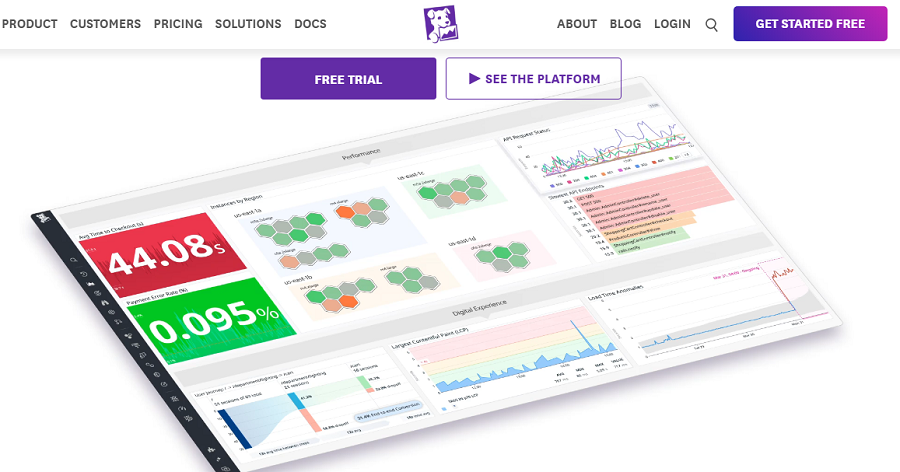
Datadog RUM is a powerful tool for monitoring your website observability, real user speed, and location views.
If you want to connect your frontend slowness to backend hiccups, you have to think of using this analytics tool.
It can segment data by country, region, city, ISP, and device. You can’t find such details for TTFB, LCP, FCP, and session times on any other web analytics tools.
Datadog offers AI features to spot unusual slowdowns in different areas and set custom goals for load times.
4. New Relic Browser

New Relic is a great observability tool that focuses on RUM for Core Web Vitals and load times.
It offers useful features like location splits, revenue dips, and scheduled synthetic checks from 30+ global spots.
New Relic provides real location insights in the free tier, which is great for small teams.
5. DebugBear
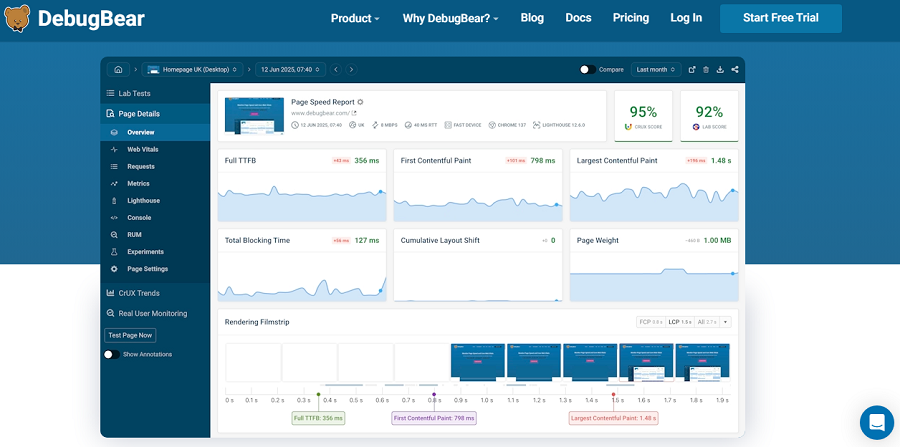
DebugBear is a budget-friendly web analytics tool that offers a mix of RUM and synthetic monitoring.
It’s great for monitoring speed metrics with a location focus. It offers RUM splits by country, city, device, and browser for Core Web Vitals, TTFB, and loads.
DebugBear offers an affordable free tier to test location tracking. Also, its straightforward reports with fix-it tips for regional optimization can help you improve your website’s performance.
Here is a comparison between these tools:
| Tool | Locations Supported | Starting Price (Monthly) |
| Google PageSpeed Insights | CrUX by country/device; labs in 3 regions | Free |
| SpeedCurve | 50+ (synthetic), global RUM | $90 |
| Datadog RUM | 100+ (synthetic), global RUM | Free |
| New Relic Browser | 30+ (synthetic), global RUM | Free |
| Akamai mPulse | 365k+ servers (synthetic), global RUM | $300 |
| DebugBear | 30+ (synthetic), global RUM | $249 |
How to Interpret Geolocation Analytics?
Tracking data on your website is not enough; you have to interpret the results correctly to be able to improve your site’s performance:
1. Find Large Gaps
If you see a big difference between your global median TTFB and regional data, you have to consider it a red flag.
This data is usually a sign of the following problem:
- The CDN PoP is too far away
- The server overburdened
- Routing is inefficient
2. Compare Similar Regions
Sometimes the issue is for an entire region. For example, if your pages load fast in Japan but have delays in South Korea, you have to think about problems like:
- ISP congestion
- Poor connectivity on specific networks
- CDN routing anomalies
3. Check Speed With Business Metrics
Regions that have slow load times usually have worse business performance. So, you have to expect the following impacts on your business when you see speed issues in a region:
- Lower conversion rates
- Higher bounce rates
- Shorter session durations
4. Consider CDN Cache Hit Rates
Low cache hit rates in specific regions can slow everything on your site down. If your content isn’t cached locally, the CDN has to get the data from the origin, which causes delays in page load time.
5. Track Third-Party Script
Unfortunately, many slowdowns are due to external issues, like:
- Ad networks
- Tracking scripts
- Social embeds
- Chat widgets
In some regions, third parties will add seconds to load time and impact user experience.
6. A/B Testing
If you want to find the best version of your page, it’s good to run A/B tests. You can consider important factors like hero image, image size, videos, etc., to see what works best in different regions.
Conclusion
Location-based analytics is really helpful in optimizing your site and reaching better results. It’s even impactful on your website speed and load time.
You have to segment your website speed based on location. This helps you detect any technical problems in different regions and improve user experience in those regions.
So, try to monitor website speed geographically and optimize your pages and technical setup accordingly.
FAQs
Does visitors’ location impact page load time?
Yes! Each region has different infrastructure, and this impacts load time.
Is it possible to monitor website speed geographically?
Yes, you can segment users based on region and monitor load time and core web vitals for each segment.
What are the most important website speed metrics?
Core Web Vitals like LCP, FCP, CLS, and INP, along with load times, are website speed metrics.