Take your business to next level
Become part of our growing family of +600,000 users and get the tools you need to make smart choices for your website. Simple, powerful insights are just a click away.
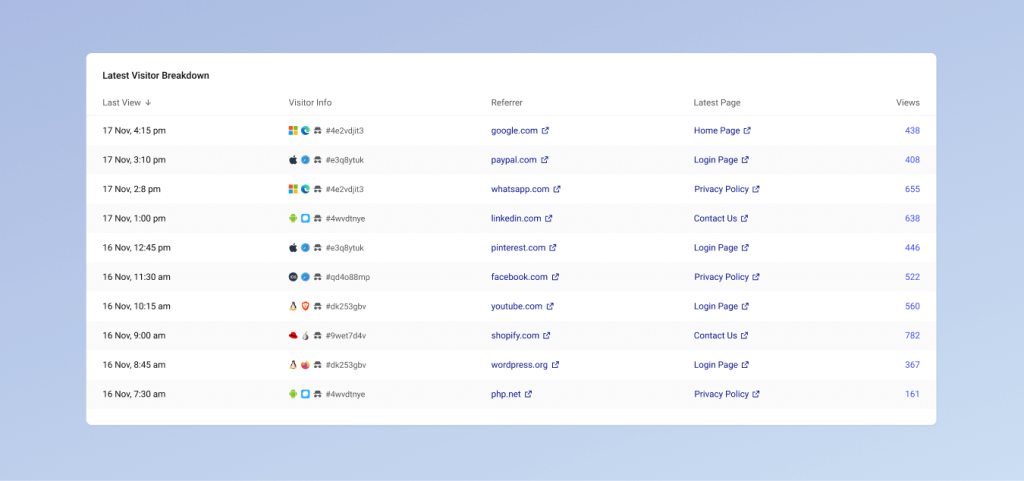
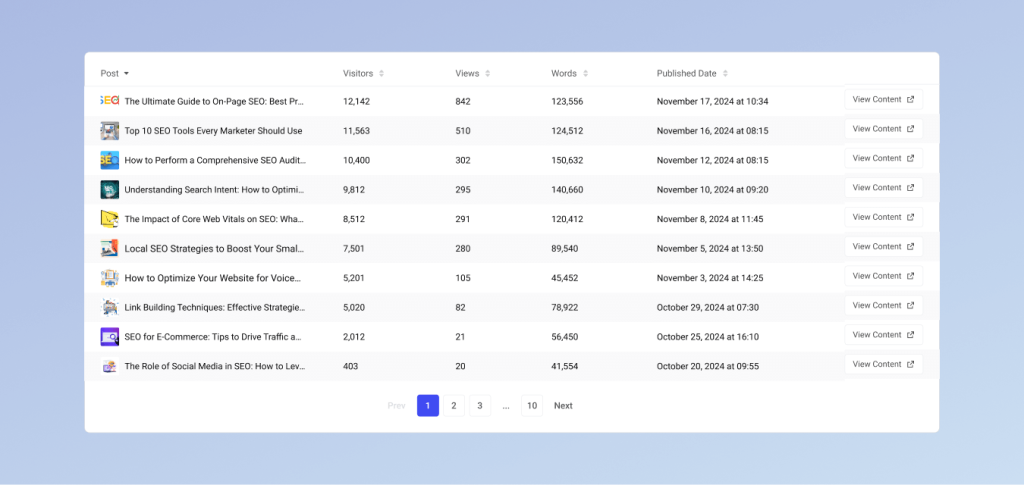
Tables are a core component of WP Statistics, providing detailed insights into your website’s data. They are used across multiple reports and dashboards, making it easy to view and analyze information effectively.

Tables display various metrics in a clear, column-based format. For example:

Some table columns are sortable. Click on the column header (e.g., Visitors, Views) to sort data in ascending or descending order, making it easier to focus on specific metrics.
Many tables provide filtering options at the top, such as:
Tables often include clickable links for quick access to additional details. For example:
Become part of our growing family of +600,000 users and get the tools you need to make smart choices for your website. Simple, powerful insights are just a click away.